


作者,Evil Genius
大家好,新的一年开始了,我们又要投入到紧张的工作中去了,作为一名10X空间和10X单细胞分析的生信人员,也要开始新一年的工作了,但是,正可谓磨刀不误砍柴功,总结也是一种进步,今天跟大家分享的就是10X空间转录组和10X单细胞数据联合分析方法的汇总。
在之前的分享中,也分享过一些联合分析的方法,比如MIA,cell2location等,但是不成体系,今天我们来详细分享一下目前10X空间转录组和10X单细胞联合分析的方法。
(1)AddModuleScore
这是Seurat包的一个函数,具体的用法我之前分享过,文章在这里Seurat包的打分函数AddModuleScore,大家可以看一下,运用这种方法进行单细胞和空间联合分析的文章是发表于cell的文章Multimodal Analysis of Composition and Spatial Architecture in Human Squamous Cell Carcinoma,这篇文章我详细解读过,文章在人鳞状细胞癌成分和空间结构的多峰分析(空间转录组与单细胞文章,我们稍微总结一下文献联合的思路
1、空间聚类
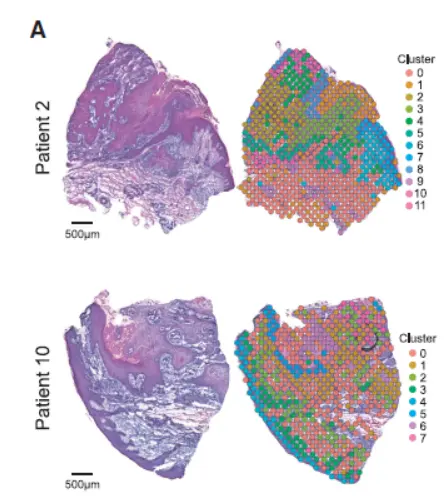
对空间转录组数据进行聚类,表达相似的spot将聚成一类。
2、AddModuleScore的运用
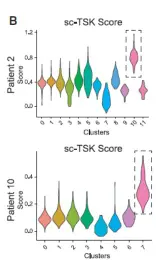
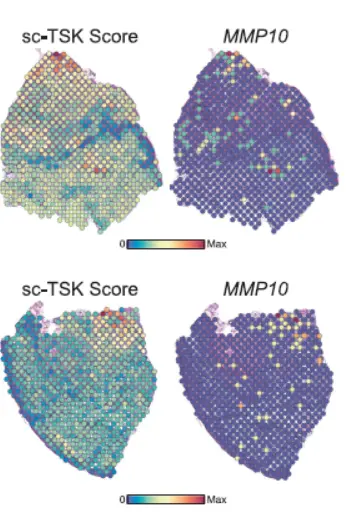
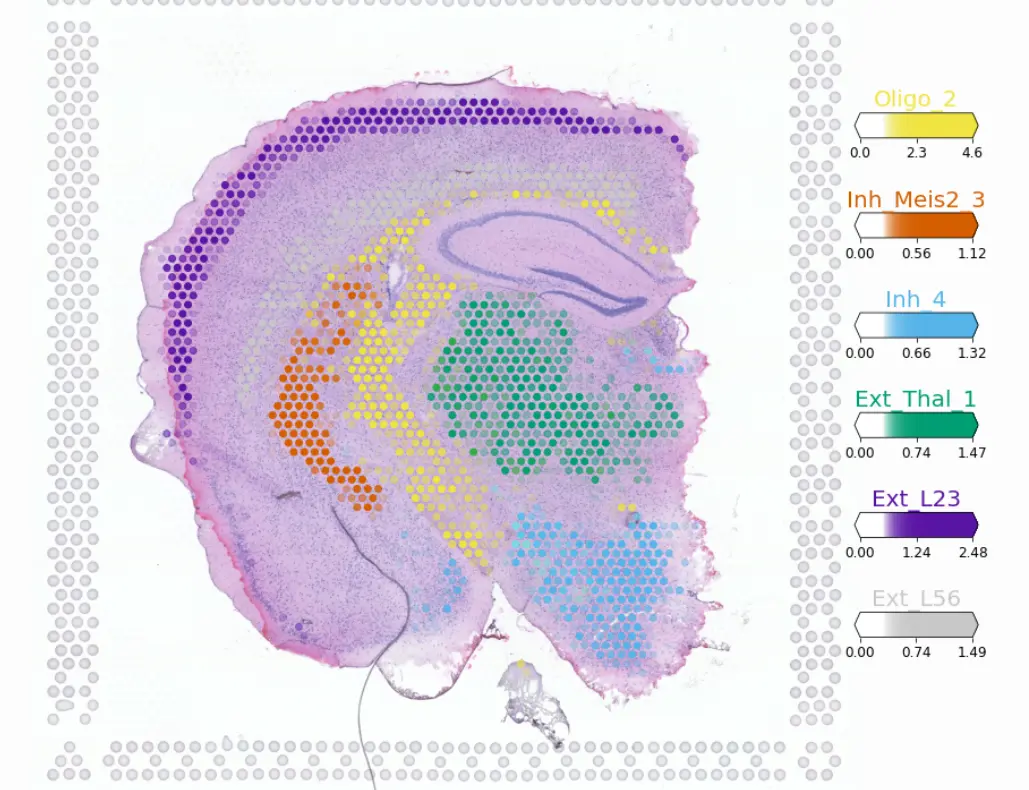
具体来讲,就是从单细胞数据分析中得到感兴趣的细胞群,以其中的部分基因作为特征,对空间聚类的结果进行AddModuleScore分析,得分越高,说明感兴趣的细胞群越处于相应cluster的位置。
这个方法同样可对spot进行”打分“分析,得到感兴趣细胞类型特征的具体分析。如下图:
.
文章很经典,有很多其他值得借鉴的地方,大家不妨多关注一下
(2)Seurat本身自带的联合分析方法FindTransferAnchors and TransferData
运用这个方法在文献Spatiotemporal analysis of human intestinal development at single-cell resolution,发表与cell,文章主要研究的是肠道发育,运用这个联合分析分析的方法,主要看看细胞类型在肠道发育过程中的变化
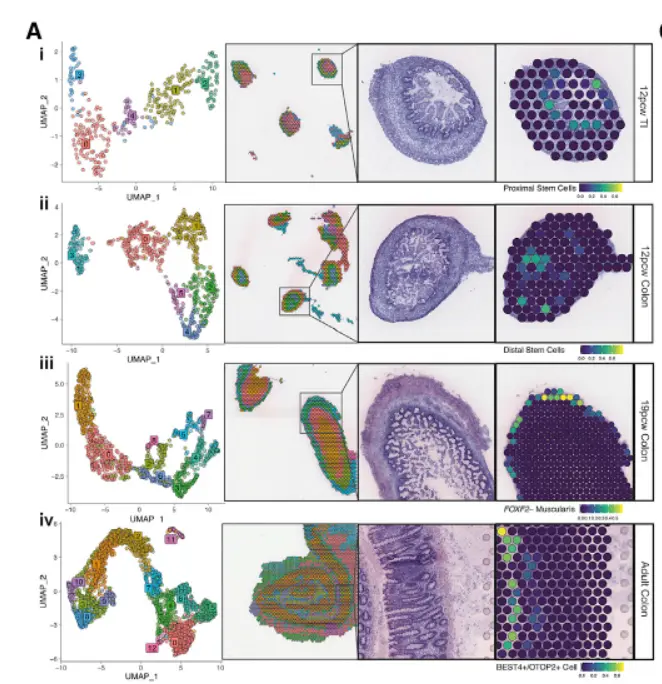
。这篇文章也很经典,文章中有很多其他经典的方法,需要我们大家好好解读一下,其中文章中提到细胞类型的spot distance-based analyses分析,是一个很好的点,我之前解读过,文章在这里空间转录组细胞类型的spot distance-based analyses,距离分析,当然还有其他,比如文章中的单细胞数据的整合方法,包括批次矫正的harmony,包括批次矫正后的验证Merged pool clusters were compared with cell types obtained from individual pools to ensure cell type heterogeneity was not lost due to batch correction,空间共定位和配受体分析,等等等等,非常经典。希望大家认真读一下,帮助很大。
(3)MIA的联合分析方法
这个方法被发表在Nature Biotechnology 上的文章

图片.png
所运用,我在之前的分析方法中详细解读过,文章在MIA用于单细胞和空间的联合分析,不过这个联合分析方法要求很高,我们来看一下过程:
1、区域划分
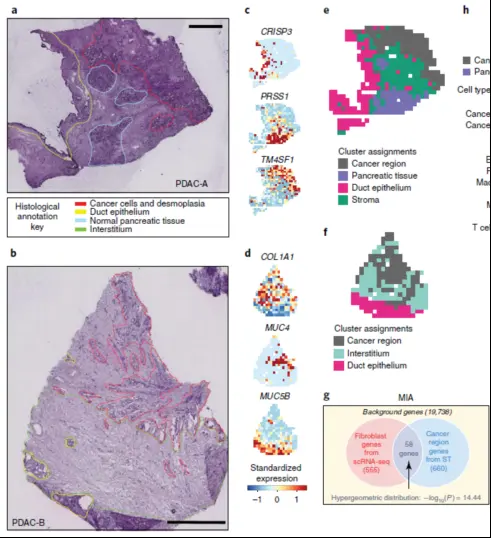
这个就需要比较强的背景,尤其对于不规则样本,更需要强有力的生物学背景作为支撑才可以划分出来,第一步就很难。
2、MIA,多模态数据取交集方法,是针对Spot Cluster 水平上利用单细胞注释信息来对ST-Spot聚类结果进行细胞类型注释。
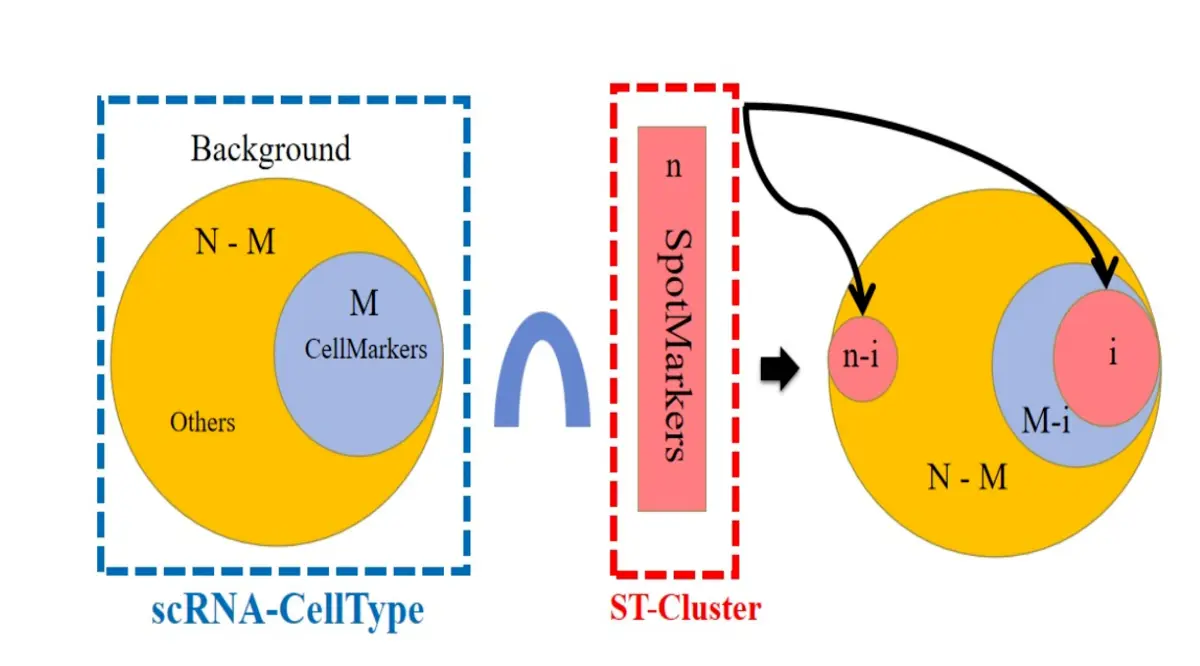
算法我就不在这里多说了,大家可以看我以前分享的文章,这个方法运用的地方会比较少。
(4)cell2location的联合分析方法
这个方法我之前分享过,文章在10X单细胞和空间联合分析的方法---cell2location,这个方法类似于之前普通转录组解卷积的方法,文章在Comprehensive mapping of tissue cell architecture via integrated single cell and spatial transcriptomics,简单看一下过程:
(1)Cell2location: a Bayesian model for spatial mapping of cell types
Cell2location maps the spatial distribution of cell types by integrating single-cell RNAseq (scRNA-seq) and multi-cell spatial transcriptomic data from a given tissue。
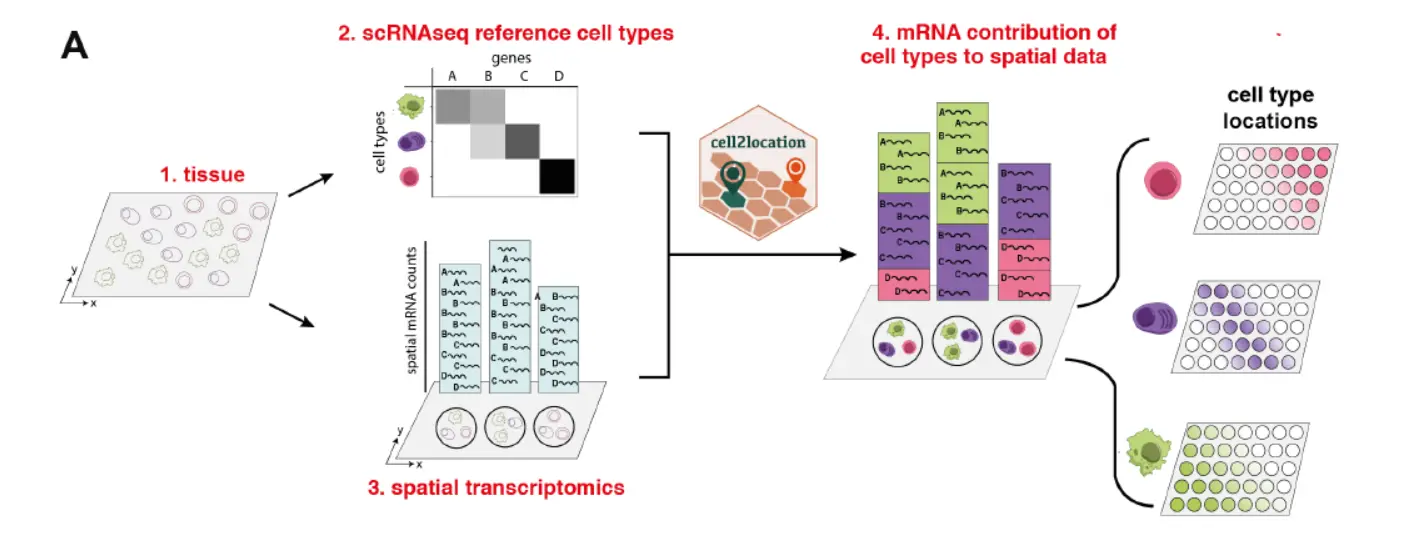
从原理图上来看,单细胞作为参考,匹配细胞类型的空间位置,这个方向无可改变。
首先第一步:利用模型估计单细胞数据的细胞类型的表达特征。例如,通过使用常规聚类来识别细胞类型和亚群,然后估算平均聚类基因表达谱而获得的结果(如下图)

,我们需要逐步分析。Cell2location基于负二项式回归实现此估算步骤,从而可以跨技术和批次可靠地组合数据。(又是数学)。
第二步:cell2location decomposes mRNA counts in spatial transcriptomic data using these reference signatures, thereby estimating the relative and absolute abundance of each cell type at each spatial location。(分解数据)。
Cell2location被实现为可解释的分层贝叶斯模型,thereby (1) providing principled means to account for model uncertainty, (2) accounting for linear dependencies in cell type abundances, (3) modelling differences in measurement sensitivity across technologies, and (4) accounting for unexplained/residual variation by employing a flexible count-based error model. Finally, (5) cell2location is computationally efficient, owing to variational approximate inference and GPU acceleration。(这些方法我们下一篇分享解析)。
To validate cell2location, we initially used simulated data that reflects diverse cell abundance and spatial patterns。(作者模拟了空间转录组数据)。
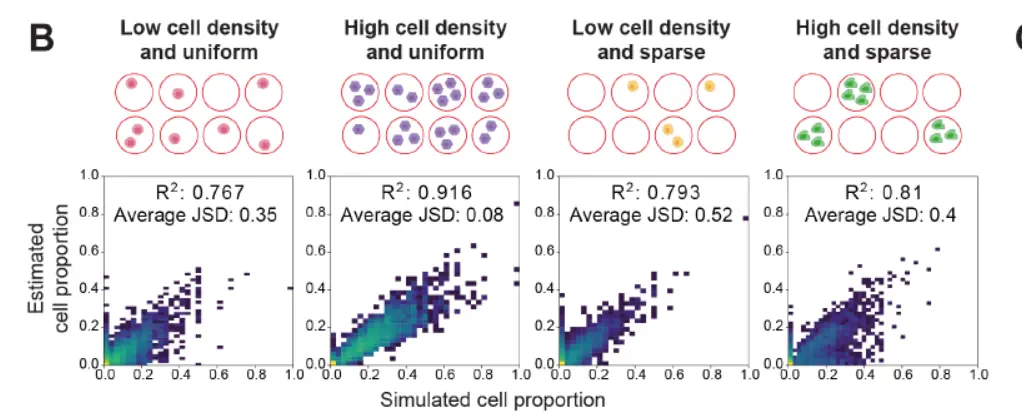
这里我们需要注意的是Jensen–Shannon divergence,也就是J-S散度,数学的内容我们下面讲解。
Briefly, we simulated a spatial transcriptomics dataset with 2,000 locations, based on reference cell-type annotations obtained from a mouse brain snRNA-seq reference dataset including 46 cell types,Multi-cell gene expression profiles at each location were derived by combining cells drawn from different reference cell types, using one of four cell abundance patterns with variable density and sparsity distribution that mimics the patterns observed in real data。然后运用cell2location进行分析,得到图中的结果。基本上有很高的相关性,但是这里有一个问题,那就是模拟的空间转录组数据是依据单细胞数据合并而来,一旦真正的空间转录组数据含有某些单细胞不存在的细胞类型(比如说技术壁垒,10X单细胞捕获中性粒细胞结果很差),那么预测的结果很可能出现错误,我们往后看看,是否作者提到这个问题。
Next, we compared cell2location to recently proposed alternative methods for the inference of relative cell-type abundance from spatial transcriptomics。一样的文献结果,自己的软件表现最好。并且该模型还产生了相对细胞类型丰度的更准确估计。
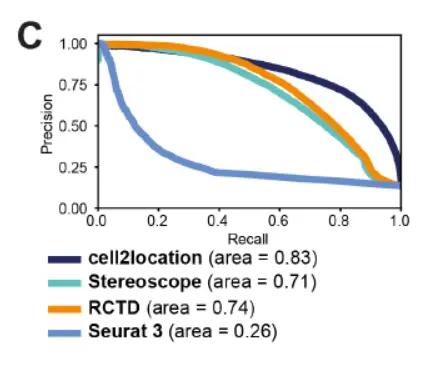
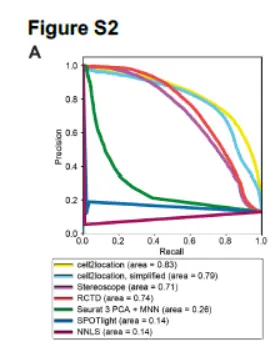
这里我们需要注意的是,PR曲线,这些数学上的问题我们下面讲解。
cell2location not only provides estimates of relative cell type fractions but additionally estimates absolute cell type abundance, which can be interpreted as the number of cells that express a reference cell type signature at a given location, which again were highly concordant with the simulated ground truth(估计细胞数量,这个也很重要)。

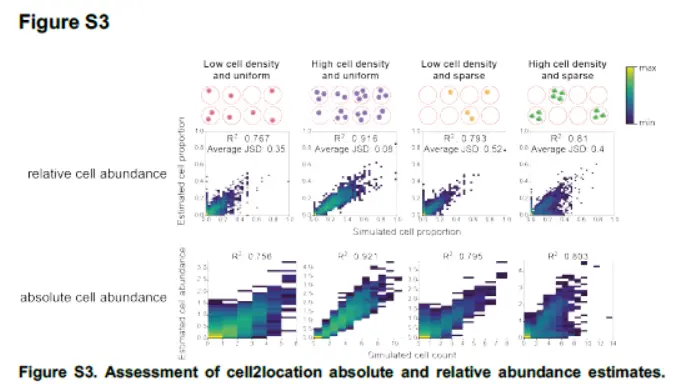
总之,these results support that cell2location can accurately estimate cell abundance across diverse cell types.
然后文章用了两个例子,运用该软见解决我们的联合分析问题。具体案例我们这里就不多说了,我们需要更多的是算法的原理。
我们首先解决一下J-S散度和PR曲线。
Jensen-Shannon divergence(J-S散度) is a method of measuring the similarity between two probability distributions。这个我们需要先知道一下KL散度。
KL散度又称为相对熵,信息散度,信息增益。KL散度是是两个概率分布P和Q 差别的非对称性的度量。 KL
散度是用来 度量使用基于Q的编码来编码来自P的样本平均所需的额外的位元数。 典型情况下,P表示数据的真实分布,Q表示数据的理论分布,模型分布,或P的近似分布。
定义如下:
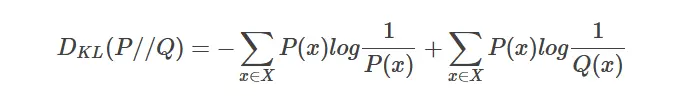
因为对数函数是凸函数,所以 KL散度的值为非负数。
-
JS散度(Jensen-Shannon)
JS散度度量了两个概率分布的相似度,基于KL散度的变体,解决了KL散度非对称的问题。一般地,JS散度是对称的,其取值是0到1之间。定义如下: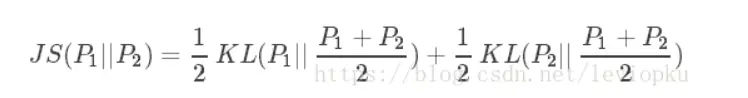
也就是图B 的结果。
PR曲线
相对于PR曲线,ROC曲线了解的更多一些,大家可以参考我关于ROC曲线的讲解深入理解R包AUcell对于分析单细胞的作用.
而PR曲线
PR曲线实则是以precision(精准率)和recall(召回率)这两个为变量而做出的曲线,其中recall为横坐标,precision为纵坐标。
那么问题来了,什么是精准率?什么是召回率?这里先做一个解释。
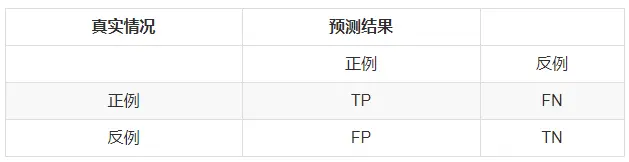
在二分类问题中,分类器将一个实例的分类标记为是或否,可以用一个混淆矩阵来表示,如下图所示。
注:把正例正确地分类为正例,表示为TP(true positive),把正例错误地分类为负例,表示为FN(false negative)。
把负例正确地分类为负例,表示为TN(true negative), 把负例错误地分类为正例,表示为FP(false positive)。
【举个栗子:A是只猫(正例),B是只仓鼠(负例),A在二分类中被划分为猫则为TP,被划分为仓鼠则为FN。B在二分类中被划分为仓鼠则为TN,被划分为猫则为。】
从混淆矩阵可以得出精准率与召回率:precision = TP/(TP + FP), recall = TP/(TP +FN)(注意:分子相同。)接下来补充一个重点:
一条PR曲线要对应一个阈值。通过选择合适的阈值,比如50%,对样本进行划分,概率大于50%的就认为是正例,小于50%的就是负例,从而计算相应的精准率和召回率。举个例子如下:(true这列表示正例或者负例,hyp这列表示阈值0.5的情况下,概率是否大于0.5)
那么根据这个表格我们可以计算:TP=6,FN=0,FP=2,TN=2。故recall=6/(6+0)=1,precison=6/(6+2)=0.75,那么得出坐标(1,0.75)。同理得到不同阈下的坐标,即可绘制出曲线。
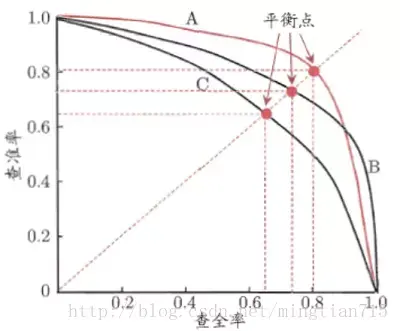
PR曲线如下:
如果一个学习器的P-R曲线被另一个学习器的P-R曲线完全包住,则可断言后者的性能优于前者,例如上面的A和B优于学习器C。但是A和B的性能无法直接判断,我们可以根据曲线下方的面积大小来进行比较,但更常用的是平衡点或者是F1值。平衡点(BEP)是P=R时的取值,如果这个值较大,则说明学习器的性能较好。而F1 = 2 * P * R /( P + R ),同样,F1值越大,我们可以认为该学习器的性能较好。
部分资料参考:二战周志华《机器学习》-PR曲线和ROC曲线
P-R曲线深入理解
两种曲线我们都需要了解一下,以免以后遇到不知道就尴尬了~~~

接下来我们来看cell2location的模型。
模型的简单介绍
For a complete derivation of the cell2location model, please see supplementary computational methods. Briefly, cell2location is a Bayesian model, which estimates absolute cell density of cell types by decomposing mRNA counts 𝑑s,g of each gene 𝑔 = {1, . . , 𝐺} at locations 𝑠 = {1, . . , 𝑆} into a set of predefined reference signatures of cell types gf g.For 10X Visium data, this matrix can be directly obtained from the 10X SpaceRanger software and imported into data format used in a popular python package Scanpy(利用scanpy来读取10X分析数据,也可以联合Suerat进行分析)。ds,g should be fltered to a set of genes expressed in the single cell reference g f g.这个地方的处理在于单细胞与空间转录组映射的时候,表达基因的相同。cell2location的图表模型如下图:
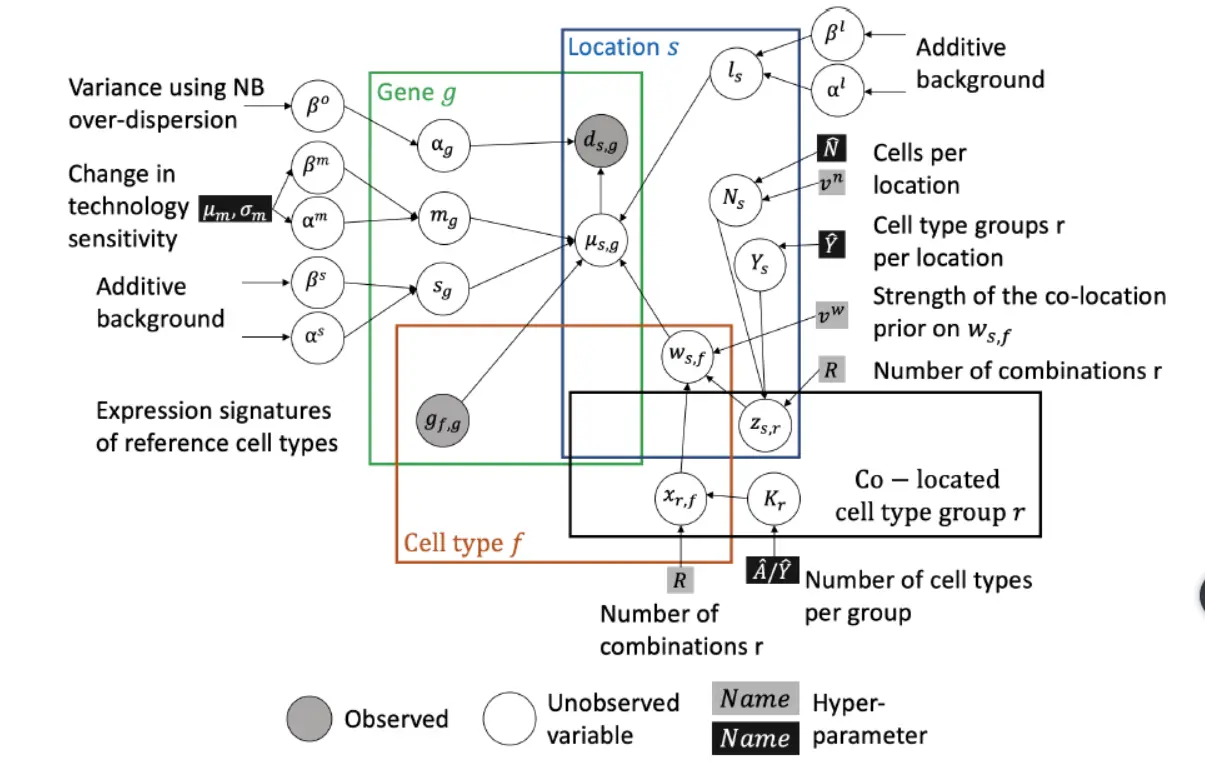
Let G = {gf,g}, denote an F X G matrix of reference cell type signatures, which consist of F = {1,..., F} gene expression profiles Gf,: for g = {1,...,G} genes, representing average expression of each gene in each cell type in linear mRNA counts space (not log-space).This matrix needs to be provided to cell2location and can be estimated from scRNA-seq profles.这个地方我们可以看到,对各个细胞类型的基因表达求平均值来代表这个细胞类型。Cell2location models the elements of D as Negative Binomial distributed,这个地方稍微说一下负二项分布,
负二项分布是统计学上一种离散概率分布。满足以下条件的称为负二项分布:实验包含一系列独立的实验, 每个实验都有成功、失败两种结果,成功的概率是恒定的,实验持续到r次不成功,r为[正整数]。可以参考百度百科负二项分布,不过从这里开始,开始涉及到很深的数学只是背景,本人数学不会,但没有因此而骄傲过,所以希望有数学的大牛来分享一下内容。
最后展示一下分析的结果,
这个方法目前处于前发,仍需要更多的验证。
(5)spotlight 分析方法
这个方法也是非负卷积分解的方法,是一个R包,目前高分文章也没有引用,不过方法还不错,关于spotlight的算法,大家可以看spotlight和spotlight_github,算法在这里不过多介绍了,如图:
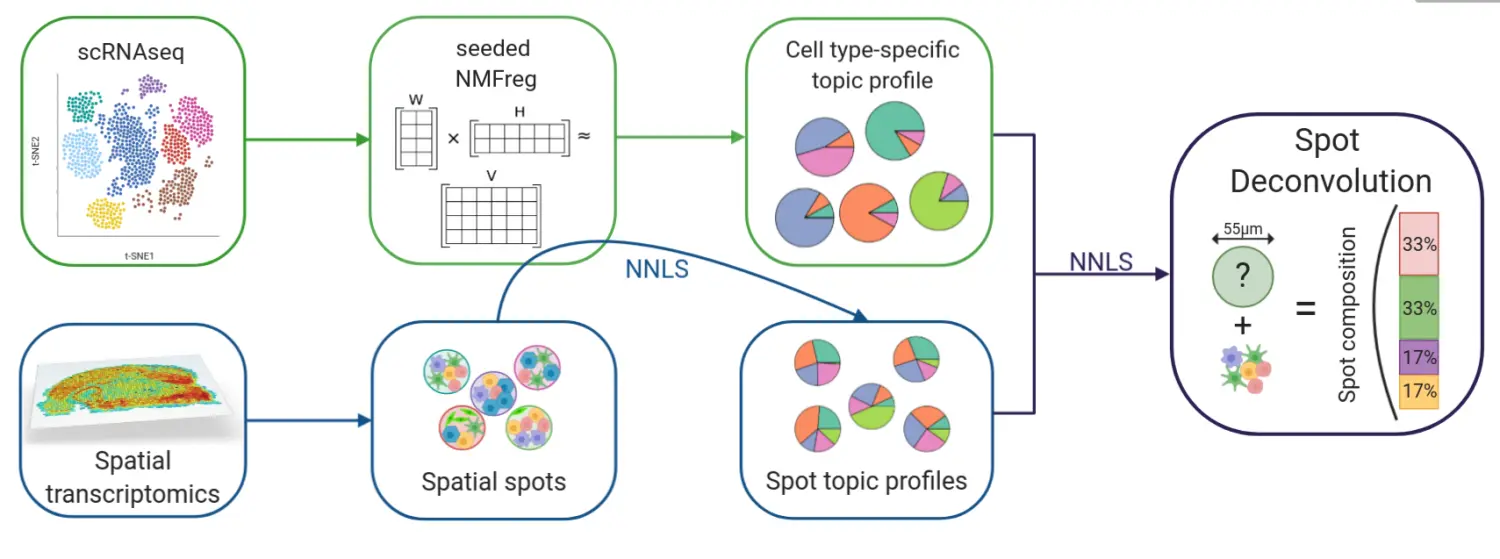
方法还不错,不过用的不多。
(6)当然还有一些其他的方法:
比如scanpy的联合分析方法,我们不再过多介绍,希望对大家有帮助。
最后送给大家一首诗,祝大家新的一年会有好的运势。
New York is three hours ahead of California, but that does not make California slow
Cameroon is six hours ahead of New York but it does not make New York slow.
Someone graduated from college at 22 but waited five years before securing a job.
Someone became a CEO at 25 but died at 50.
Someone became a CEO at 50 but lived to 90 years.
Someone is still single,
While another is married with children
Absolutely, everyone in this world works based on their own time zone.
People around you might seem to be ahead of you.
That's total fine. Some are behind you.
Everyone is running their own race in their own time zone.
Don't envy or mock them.
They are in their own time zone and you are in yours.
Life is about waiting for the right moment to react.
So RELAX.
You're not late
You're not early
You're very much on time, and in your time zone.
Everyone have a different exams paper meaning different questions.
Everyone have a different assignment meaning different purpose in life.
So focus on your own exam paper, your assignment and purpose.
Don't copy and paste or steal answer else you will fail big time.
Your dreams and visions are all valid. Just take your time and do the best you can.
Be like the hummingbird. Even when mighty lions and tigers underestimated him, he continued to do what he could, where he was, just as he was, with the little he had.
You're ok just the way you are. The little work you are doing today might seem insignificant but I bet someday you will see the big picture.
You're Not late! You're Not early.


 2250
2250

 被折叠的 条评论
为什么被折叠?
被折叠的 条评论
为什么被折叠?
 到【灌水乐园】发言


