


总览
plt.scatter()
plt.setp() 批量设置某对象的属性
plt.getp(obj, property) 获取某对象的属性, 相当于obj.get_somename().
plt.close() 完全关闭图形窗口
plt.clf() 清除当前figure
plt.xscale(‘log’) 设置坐标比例
plt.subplots_adjust(top=0.92, bottom=0.08, left=0.10, right=0.95, hspace=0.25,wspace=0.35)调整子图布局
plt.tight_layout() 固定间距配置
Pyplot tutorial
Intro to pyplot
pyplot 的函数 模仿了matlab的用法.
如果只提供一个数组或列表, Matplotlib会假设这是y的值, 然后会自动生成x值
Formatting the style of your plot
所有的序列在内部都会被转化为numpy数组.
Plotting with keyword strings
某些情况,你的数据格式允许你用字符串访问特定变量.
如果我们指定了data参数, 就可以使用对应于这些变量的字符串.
例如我们使用的字符串例如’a’都会被解释成data[‘a’].
data = {'a': np.arange(50),
        'c': np.random.randint(0, 50, 50),
        'd': np.random.randn(50)}
data['b'] = data['a'] + 10 * np.random.randn(50)
data['d'] = np.abs(data['d']) * 100

plt.scatter('a', 'b', c='c', s='d', data=data)
'''
相当于
plt.scatter(data['a'], data['b'], c=data['c'], s=data['d'])
'''
plt.xlabel('entry a')
plt.ylabel('entry b')
plt.show()
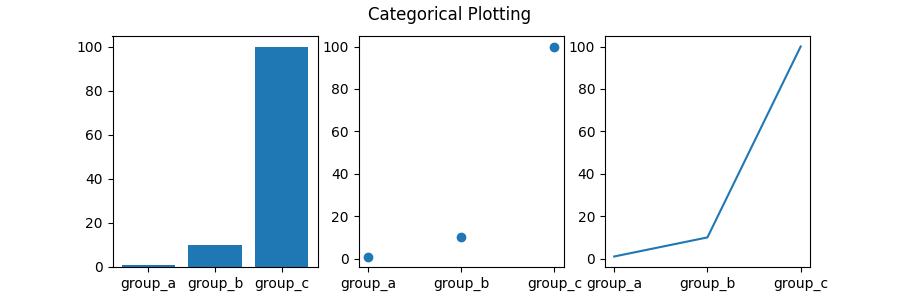
Plotting with categorical variables
使用分类变量绘制.
names = ['group_a', 'group_b', 'group_c']
values = [1, 10, 100]

plt.figure(figsize=(9, 3))

plt.subplot(131)
plt.bar(names, values)
plt.subplot(132)
plt.scatter(names, values)
plt.subplot(133)
plt.plot(names, values)
plt.suptitle('Categorical Plotting')
plt.show()
Controlling line properties
下面有几种方法设置线的属性
法一:
plt.plot(x, y, linewidth=2.0)
法二: 用Line2D实例的setter方法
line, = plt.plot(x, y, '-')
line.set_antialiased(False) # turn off antialiasing
# 关掉抗锯齿
法三: 用setp, matlab风格的函数, 可以设置多种属性. 处理对象列表或一个对象. 可以用python关键字参数 或 matlab风格 的字符串/值 对.
lines = plt.plot(x1, y1, x2, y2)
# use keyword arguments
plt.setp(lines, color='r', linewidth=2.0)
# or MATLAB style string value pairs
plt.setp(lines, 'color', 'r', 'linewidth', 2.0)
- plt.setp()
可以设置参数还可以查询有哪些允许值.
x = np.arange(0, 1, 0.01)
lines = plt.plot(x, np.sin(2*np.pi*x), x, np.sin(4*np.pi*x))

plt.setp(lines, linewidth=2, color='r') # 两条线均受影响
The artist(s) whose properties are being set or queried. When setting properties, all artists are affected; when querying the allowed values, only the first instance in the sequence is queried.
设置值的时候,所有artists都会被影响, 当查询允许的值的时候, 只有序列中的第一个实例会被查询.
# 查询线形
plt.setp(lines, 'linestyle')
# linestyle: {'-', '--', '-.', ':', '', (offset, on-off-seq), ...}

# 查询所有属性允许值
plt.setp(lines)
'''
agg_filter: a filter function, which takes a (m, n, 3) float array and a dpi value, and returns a (m, n, 3) array
  alpha: scalar or None
  animated: bool
  antialiased or aa: bool
  clip_box: `.Bbox`
  clip_on: bool
  clip_path: Patch or (Path, Transform) or None
  color or c: color
  dash_capstyle: `.CapStyle` or {'butt', 'projecting', 'round'}
  dash_joinstyle: `.JoinStyle` or {'miter', 'round', 'bevel'}
  dashes: sequence of floats (on/off ink in points) or (None, None)
  data: (2, N) array or two 1D arrays
  drawstyle or ds: {'default', 'steps', 'steps-pre', 'steps-mid', 'steps-post'}, default: 'default'
  figure: `.Figure`
  fillstyle: {'full', 'left', 'right', 'bottom', 'top', 'none'}
  gid: str
  in_layout: bool
  label: object
  linestyle or ls: {'-', '--', '-.', ':', '', (offset, on-off-seq), ...}
  linewidth or lw: float
  marker: marker style string, `~.path.Path` or `~.markers.MarkerStyle`
  markeredgecolor or mec: color
  markeredgewidth or mew: float
  markerfacecolor or mfc: color
  markerfacecoloralt or mfcalt: color
  markersize or ms: float
  markevery: None or int or (int, int) or slice or list[int] or float or (float, float) or list[bool]
  path_effects: `.AbstractPathEffect`
  picker: float or callable[[Artist, Event], tuple[bool, dict]]
  pickradius: float
  rasterized: bool
  sketch_params: (scale: float, length: float, randomness: float)
  snap: bool or None
  solid_capstyle: `.CapStyle` or {'butt', 'projecting', 'round'}
  solid_joinstyle: `.JoinStyle` or {'miter', 'round', 'bevel'}
  transform: `.Transform`
  url: str
  visible: bool
  xdata: 1D array
  ydata: 1D array
  zorder: float
'''
- plt.getp(obj, property) 返回属性值
如果property 是 ‘somename’ 则该函数会调用obj.get_somename().
如果不写property 则会打印该obj的所有属性.
plt.getp(lines[0],'linestyle')
# '-'

plt.getp(lines)
'''
   agg_filter = None
    alpha = None
    animated = False
    antialiased or aa = True
    children = []
    clip_box = TransformedBbox(     Bbox(x0=0.0, y0=0.0, x1=1.0, ...
    clip_on = True
    clip_path = None
    color or c = r
    dash_capstyle = butt
    dash_joinstyle = round
    data = (array([0.  , 0.01, 0.02, 0.03, 0.04, 0.05, 0.06, ...
    drawstyle or ds = default
    figure = Figure(640x480)
    fillstyle = full
    gid = None
    in_layout = True
    label = _child0
    linestyle or ls = -
    linewidth or lw = 2.0
    marker = None
    markeredgecolor or mec = r
    markeredgewidth or mew = 1.0
    markerfacecolor or mfc = r
    markerfacecoloralt or mfcalt = none
    markersize or ms = 6.0
    markevery = None
    path = Path(array([[ 0.00000000e+00,  0.00000000e+00],   ...
    path_effects = []
    picker = None
    pickradius = 5
    rasterized = False
    sketch_params = None
    snap = None
    solid_capstyle = projecting
    solid_joinstyle = round
    transform = CompositeGenericTransform(     TransformWrapper(  ...
    transformed_clip_path_and_affine = (None, None)
    url = None
    visible = True
    xdata = [0.   0.01 0.02 0.03 0.04 0.05]...
    xydata = [[0.         0.        ]  [0.01       0.06279052] ...
    ydata = [0.         0.06279052 0.12533323 0.18738131 0.248...
    zorder = 2
'''
注: 写plt.getp(lines,‘linestyle’)会报错 因为lines是list 没有get_linestyle方法.
Working with multiple figures and axes
gcf 获取当前figure gca获取当前axes.
clf 清除当前figure cla 清除当前axes.
如果figure不存在则会自动创建, axes同理.
plt.close 关掉figure
plt.close() 将完全关闭图形窗口,其中 plt.clf() 只会清除图形
plt.cla() # 清除axes,即当前 figure 中的活动的axes,但其他axes保持不变。
plt.clf() # 清除当前 figure 的所有axes,但是不关闭这个 window,所以能继续复用于其他的 plot。
plt.close() # 关闭 window,如果没有指定,则指当前 window。
Working with text
Using mathematical expressions in text
Matplotlib内置TeX表达式解析器(parser), 所以无需安装LaTeX.
Logarithmic and other nonlinear axes
pyplot 不只支持线性比例, 也支持log(对数)比例, symlog(对称对数)比例, logit比例.
- plt.xscale(‘log’)
# Fixing random state for reproducibility
np.random.seed(19680801)

# make up some data in the open interval (0, 1)
y = np.random.normal(loc=0.5, scale=0.4, size=1000)
y = y[(y > 0) & (y < 1)]
y.sort()
x = np.arange(len(y))

# plot with various axes scales
plt.figure()

# linear
plt.subplot(221)
plt.plot(x, y)
plt.yscale('linear')
plt.title('linear')
plt.grid(True)

# log
plt.subplot(222)
plt.plot(x, y)
plt.yscale('log')
plt.title('log')
plt.grid(True)

# symmetric log
plt.subplot(223)
plt.plot(x, y - y.mean())
plt.yscale('symlog', linthresh=0.01)
plt.title('symlog')
plt.grid(True)

# logit
plt.subplot(224)
plt.plot(x, y)
plt.yscale('logit')
plt.title('logit')
plt.grid(True)
# Adjust the subplot layout, because the logit one may take more space
# than usual, due to y-tick labels like "1 - 10^{-3}"
plt.subplots_adjust(top=0.92, bottom=0.08, left=0.10, right=0.95, hspace=0.25,
                    wspace=0.35)

plt.show()
- subplots_adjust 调整子图的布局参数
left:所有子图整体相对于图像的左外边距,距离单位为图像宽度的比例(小数)。可选参数。浮点数。默认值为0.125。
right:所有子图整体相对于图像的右外边距,距离单位为图像宽度的比例(小数)。可选参数。浮点数。默认值为0.0。
bottom:所有子图整体相对于图像的下外边距,距离单位为图像高度的比例(小数)。可选参数。浮点数。默认值为0.11。
top:所有子图整体相对于图像的上外边距,距离单位为图像高度的比例(小数)。可选参数。浮点数。默认值为0.88。
wspace:子图间宽度内边距,距离单位为子图平均宽度的比例(小数)。浮点数。默认值为0.2。
hspace:子图间高度内边距,距离单位为子图平均高度的比例(小数)。可选参数。浮点数。默认值为0.2。

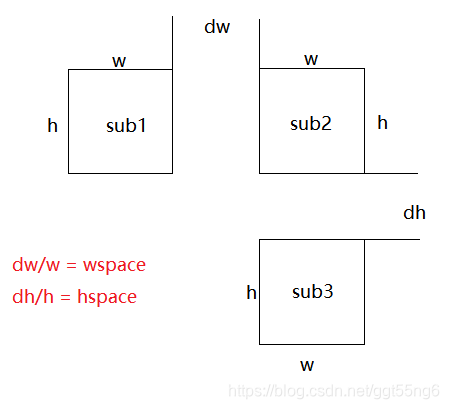
subplots_adjust是修改子图间距的通用函数,tight_layout默认执行一种固定的间距配置,也可以自定义间距配置,底层原理类似于subplots_adjust函数。
- tight_layout


 7865
7865


 被折叠的 条评论
为什么被折叠?
被折叠的 条评论
为什么被折叠?
 到【灌水乐园】发言


