


执行环境:Google Colab
!pip install basemap
- 下载basemap用于在地图上绘制2D数据。
import os
import json
import numpy as np
import matplotlib.pyplot as plt
import matplotlib.image as mpimg
import matplotlib.gridspec as gridspec
from mpl_toolkits.basemap import Basemap
- 导入相关的library。
!git clone https://github.com/JeffereyWu/flood-dataset.git
- 下载数据集
# set environment variables
%set_env LOCAL_DATA_DIR=/content/flood-dataset
- 设置一个环境变量来存储数据目录的路径
# set paths for images and masks
image_dir=os.path.join(os.getenv('LOCAL_DATA_DIR'), 'images')
mask_dir=os.path.join(os.getenv('LOCAL_DATA_DIR'), 'masks')
- 创建图像和掩码文件夹的完整路径,帮助程序在后续的操作中定位和访问这些文件夹中的数据。
统计每个地区的图像数量
# define function to count number of images per region
def count_num_images(file_dir):
    """
    This function returns a dictionary representing the count of images for each region as the key.
    """
    # list all files in the directory
    file_list=os.listdir(file_dir)
    region_count={}
    # iterate through the file_list and count by region
    for file_name in file_list:
        region=file_name.split('_')[0]
        if (len(file_name.split('.'))==2) and (region in region_count):
            region_count[region]+=1
        elif len(file_name.split('.'))==2:
            region_count[region]=1
    return region_count
- 首先使用 _ 符号分割文件名,以获取地区的名称。
- 然后,检查文件名是否包含扩展名(扩展名由一个点 . 分隔),如果包含扩展名并且地区在 region_count 字典中已经存在,那么就增加该地区的图像数量;
- 如果扩展名存在但地区不在字典中,就将该地区的图像数量初始化为1。
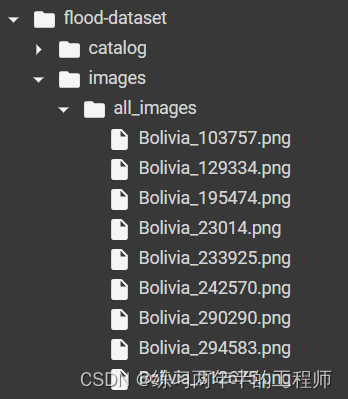
- 文件目录如下图所示:
统计不同地区的图像和掩码数量
# count images and masks by region
images_count=count_num_images(os.path.join(image_dir, 'all_images'))
masks_count=count_num_images(os.path.join(mask_dir, 'all_masks'))
# display counts
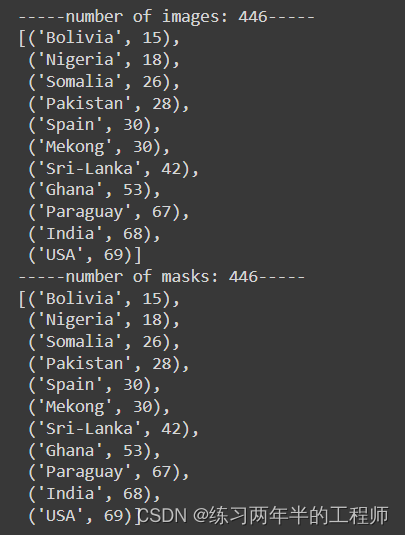
print(f'-----number of images: {sum(images_count.values())}-----')
display(sorted(images_count.items(), key=lambda x: x[1]))
print(f'-----number of masks: {sum(masks_count.values())}-----')
display(sorted(masks_count.items(), key=lambda x: x[1]))
- 使用 sorted 函数,以字典项的value(图像数量)作为排序的关键,然后调用 display 函数将排序后的结果显示出来。
输出为:
从目录文件中提取图像的边界坐标
# define function to get coordinates from catalog
def get_coordinates(catalog_dir):
    """
    This function returns a list of boundaries for every image as [[lon, lat], [lon, lat], [lon, lat], etc.] in the catalog.
    """
    catalog_list=os.listdir(catalog_dir)
    all_coordinates=[]
    for catalog in catalog_list:
        # check if it's a directory based on if file_name has an extension
        if len(catalog.split('.'))==1:
            catalog_path=f'{catalog_dir}/{catalog}/{catalog}.json'
            # read catalog
            with open(catalog_path) as f:
                catalog_json=json.load(f)
            # parse out coordinates
            coordinates_list=catalog_json['geometry']['coordinates'][0]
            lon=[coordinates[0] for coordinates in coordinates_list]
            all_coordinates.append(lon)
            lat=[coordinates[1] for coordinates in coordinates_list]
            all_coordinates.append(lat)
    return all_coordinates
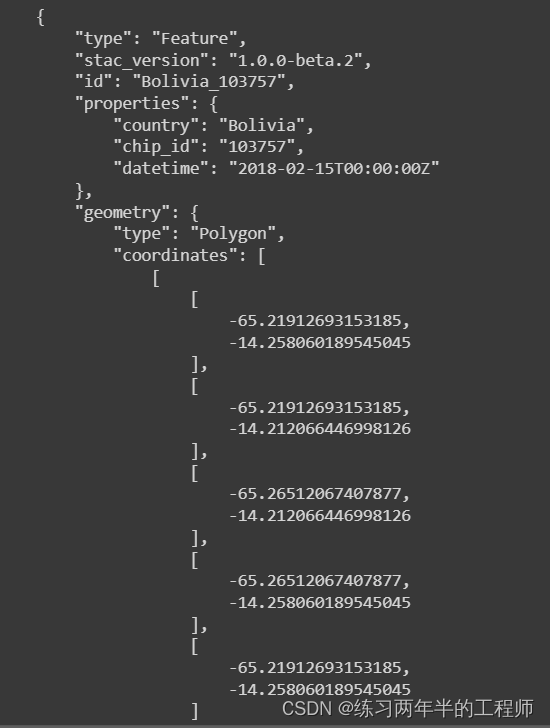
- 检查文件名是否包含扩展名,以确定它是否是一个目录。如果是目录,构建目录文件的路径并尝试读取该目录文件。
- 一旦成功读取目录文件,解析文件中的坐标信息。具体来说,从 JSON 文件中提取了坐标信息,然后将经度(lon)和纬度(lat)分别提取出来,并将它们添加到 all_coordinates 列表中。
- JSON文件的内容如下:
通过将图像的坐标信息映射到地图上,以便用户更好地理解图像在地理空间上的分布
# set paths for images catalog
image_catalog_dir=os.path.join(os.getenv('LOCAL_DATA_DIR'), 'catalog', 'sen1floods11_hand_labeled_source')
image_coordinates_list=get_coordinates(image_catalog_dir)
# create figure
plt.figure(figsize=(15, 10))
# create a Basemap
m=Basemap(projection='merc', llcrnrlat=-80, urcrnrlat=80, llcrnrlon=-180, urcrnrlon=180)
# display blue marble image
m.bluemarble(scale=0.2) # 0.2 downsamples to 1350x675 image
m.drawcoastlines(color='white', linewidth=0.2) # add coastlines
m.drawparallels(range(-90, 90, 10), labels=[0, 1, 0, 0], color='white', textcolor='black')
m.drawmeridians(range(-180, 180, 10), labels=[0, 0, 0, 1], color='white', textcolor='black', rotation=90)
# flatten lat and lon coordinate lists
image_lon=[image_coordinates_list[x] for x in range(len(image_coordinates_list)) if x%2==0]
# 将包含经度信息的二维列表 image_lon 转换成一个简单的一维数组
image_lon=np.concatenate(image_lon).ravel()
image_lat=[image_coordinates_list[x] for x in range(len(image_coordinates_list)) if x%2==1]
image_lat=np.concatenate(image_lat).ravel()
# convert lon/lat to x/y map projection coordinates
x, y=m(image_lon, image_lat)
plt.scatter(x, y, s=10, marker='o', color='Red')
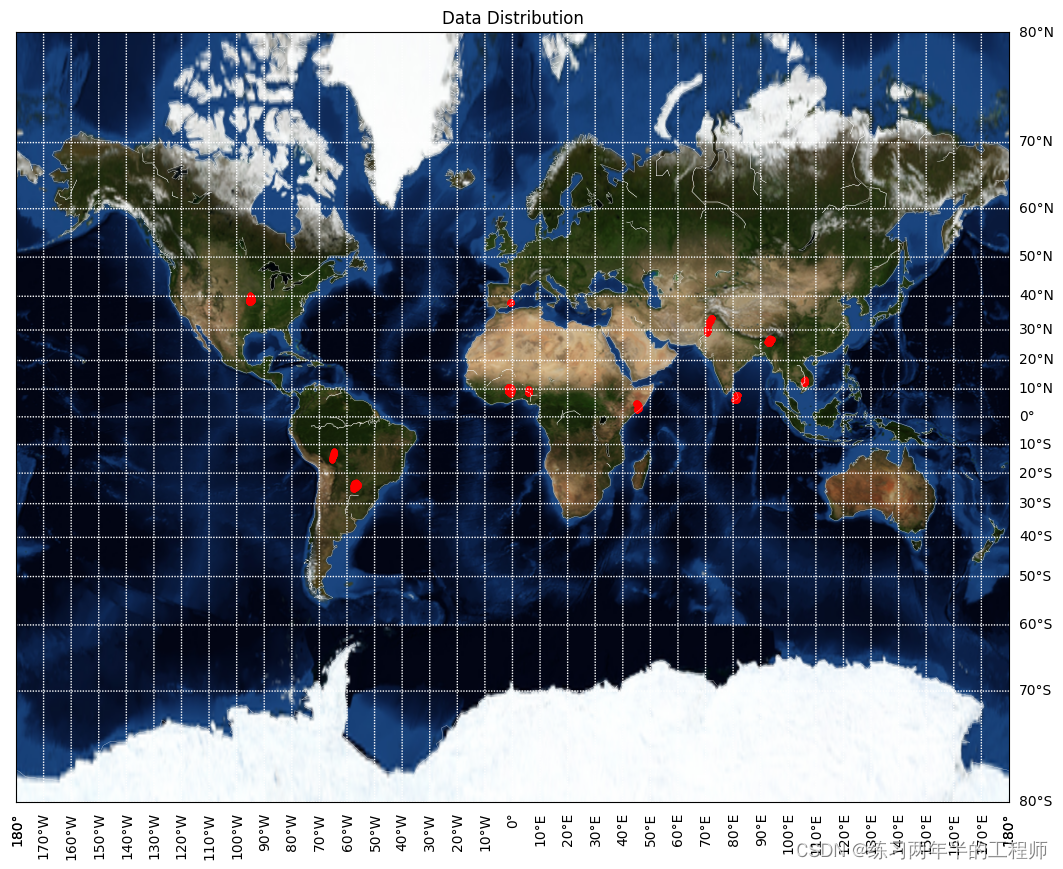
plt.title('Data Distribution')
plt.show()
- 创建一个 Basemap 对象,定义地图的投影方式(mercator 投影)和地图的范围(经度和纬度的范围)。Mercator 投影的主要特点是将地球上的经纬度坐标映射到平面上,使得经线和纬线在地图上呈直线。
从目录文件中获取图像的范围
# define function to get extent of an image from catalog
def get_extent(file_path):
    """
    This function returns the extent as [left, right, bottom, top] for a given image.
    """
    # read catalog for image
    with open(file_path) as f:
        catalog_json=json.load(f)
    coordinates=catalog_json['geometry']['coordinates'][0]
    coordinates=np.array(coordinates)
    # get boundaries
    # 提取第1个column,也就是经度
    left=np.min(coordinates[:, 0])
    right=np.max(coordinates[:, 0])
    # 提取第2个column,也就是纬度
    bottom=np.min(coordinates[:, 1])
    top=np.max(coordinates[:, 1])
    return left, right, bottom, top
- 从坐标数组中提取了最小经度、最大经度、最小纬度和最大纬度。这四个值分别表示图像的左、右、底和顶边界。
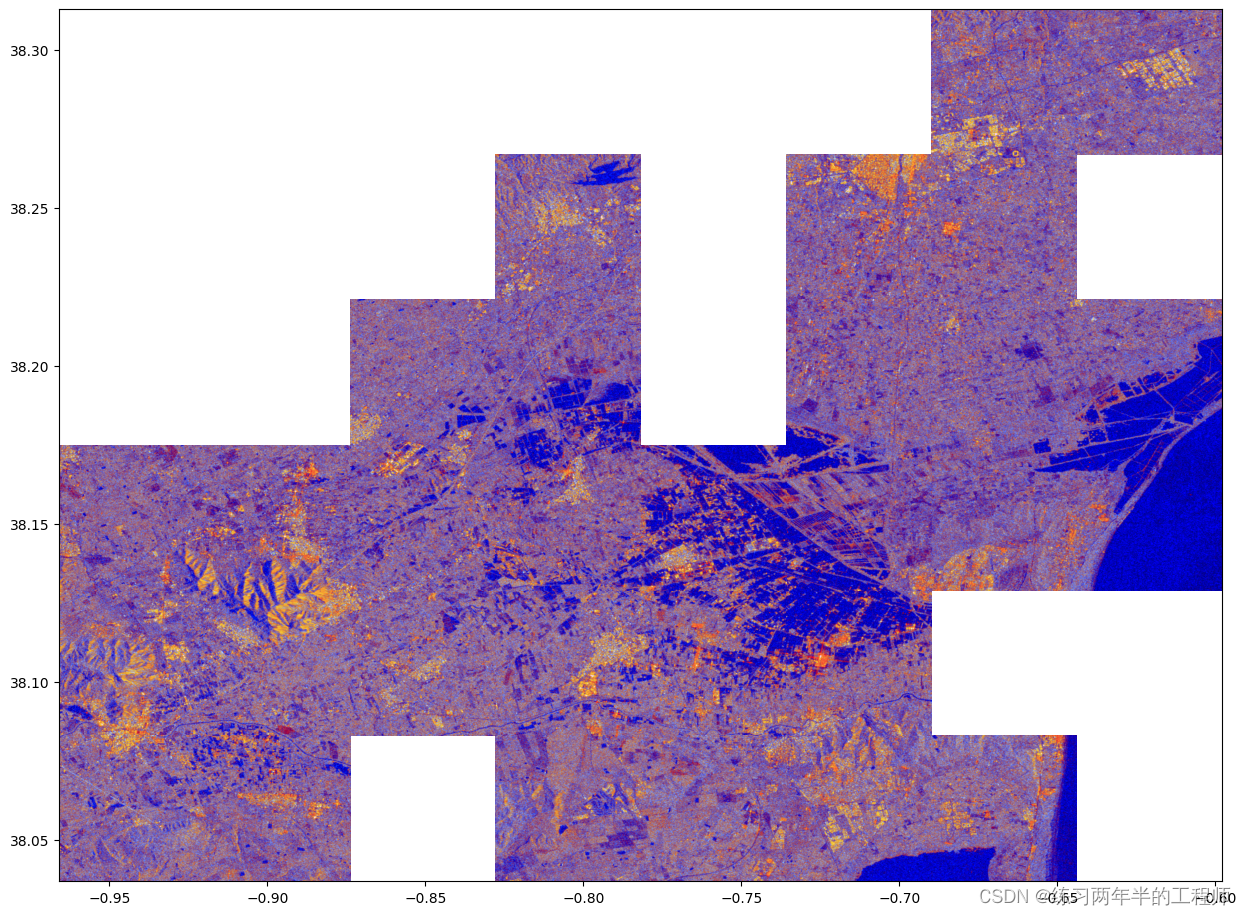
根据指定的地区以及图像或掩码类型,绘制相应的图像或掩码
# define function to plot by region
def tiles_by_region(region_name, plot_type='images'):
    # set catalog and images/masks path
    catalog_dir=os.path.join(os.getenv('LOCAL_DATA_DIR'), 'catalog', 'sen1floods11_hand_labeled_source')
    # 如果 plot_type 是 "images",则使用图像目录和 'viridis' 颜色映射;如果是 "masks",则使用掩码目录和 'gray' 颜色映射。
    if plot_type=='images':
        dir=os.path.join(image_dir, 'all_images')
        cmap='viridis'
    elif plot_type=='masks':
        dir=os.path.join(mask_dir, 'all_masks')
        cmap='gray'
    else:
        raise Exception('Bad Plot Type')

    # initiate figure boundaries, which will be modified based on the extent of the tiles
    x_min, x_max, y_min, y_max=181, -181, 91, -91
    fig=plt.figure(figsize=(15, 15))
    ax=plt.subplot(111)

    # iterate through each image/mask and plot
    file_list=os.listdir(dir)
    for each_file in file_list:
        # 检查文件是否是 ".png" 文件,同时检查文件名中的地区名称是否与 region_name 匹配。
        if (each_file.split('.')[-1]=='png') & (each_file.split('_')[0]==region_name):
            # get boundaries of the image
            extent=get_extent(f"{catalog_dir}/{each_file.split('.')[0]}/{each_file.split('.')[0]}.json")
            # 根据获取的范围更新图形边界的范围
            x_min, x_max=min(extent[0], x_min), max(extent[1], x_max)
            y_min, y_max=min(extent[2], y_min), max(extent[3], y_max)
            image=mpimg.imread(f'{dir}/{each_file}')
            plt.imshow(image, extent=extent, cmap=cmap)

    # 设置图形的坐标轴范围,以确保图像或掩模的显示范围不超出图形
    ax.set_xlim([x_min, x_max])
    ax.set_ylim([y_min, y_max])
    plt.show()

tiles_by_region(region_name='Spain', plot_type='images')


 502
502


 被折叠的 条评论
为什么被折叠?
被折叠的 条评论
为什么被折叠?
 到【灌水乐园】发言


