


将生成的reward数据生成在文本文件中,一般来说,多几次训练数据越多的实验数据画的图效果越好。以下为单个图像的代码与效果图。epoch为25。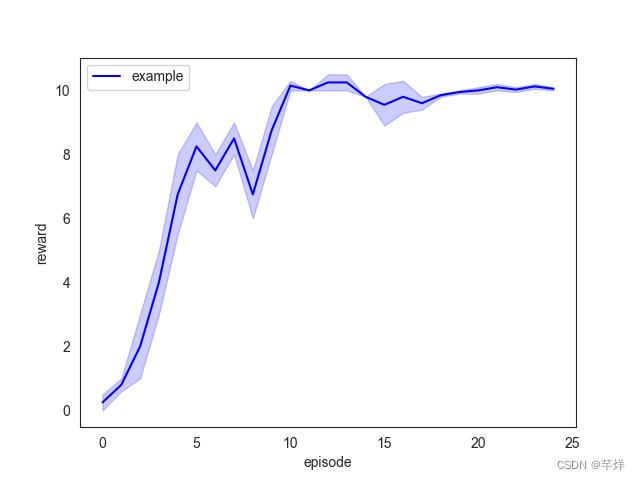
import matplotlib.pyplot as plt
import numpy as np
import seaborn as sns

with open('examp1.txt', 'r') as file:
    content = file.read()
rewards1 = []
for line in content.split('\n'):
    if line:
        rewards1.append(float(line))

with open('examp2.txt', 'r') as file:
    content = file.read()
rewards2 = []
for line in content.split('\n'):
    if line:
        rewards2.append(float(line))

rewards = np.concatenate((rewards1, rewards2))
episode1 = range(len(rewards1))
episode2 = range(len(rewards2))
episode = np.concatenate((episode1, episode2))
sns.set_style('white')

sns.lineplot(x=episode, y=rewards, color='blue', label='example')

plt.xlabel("episode")
plt.ylabel("reward")

plt.savefig('episode reward 图像')
plt.show()
生成对比图只要把对比的数据保存下来接着仿照下面的例子就可以了,以下为两个reward对比图像的代码与效果图。epoch为25。多个的对比图同理。
with open('examp1.txt', 'r') as file:
    content = file.read()
rewards1 = []
for line in content.split('\n'):
    if line:
        rewards1.append(float(line))

with open('examp2.txt', 'r') as file:
    content = file.read()
rewards2 = []
for line in content.split('\n'):
    if line:
        rewards2.append(float(line))

with open('examp3.txt', 'r') as file:
    content = file.read()
rewards3 = []
for line in content.split('\n'):
    if line:
        rewards3.append(float(line))

with open('examp4.txt', 'r') as file:
    content = file.read()
rewards4 = []
for line in content.split('\n'):
    if line:
        rewards4.append(float(line))

rewards = np.concatenate((rewards1, rewards2))
rewardss = np.concatenate((rewards3, rewards4))

episode1 = range(len(rewards1))
episode2 = range(len(rewards2))
episode3 = range(len(rewards3))
episode4 = range(len(rewards4))
episode = np.concatenate((episode1, episode2))
episodes = np.concatenate((episode3, episode4))

sns.set_style('white')
sns.lineplot(x=episode, y=rewards, color='blue', label='example1')
sns.lineplot(x=episodes, y=rewardss, color='red', label='example2')

plt.xlabel("episode")
plt.ylabel("reward")

plt.savefig('episode reward 图像')
plt.show()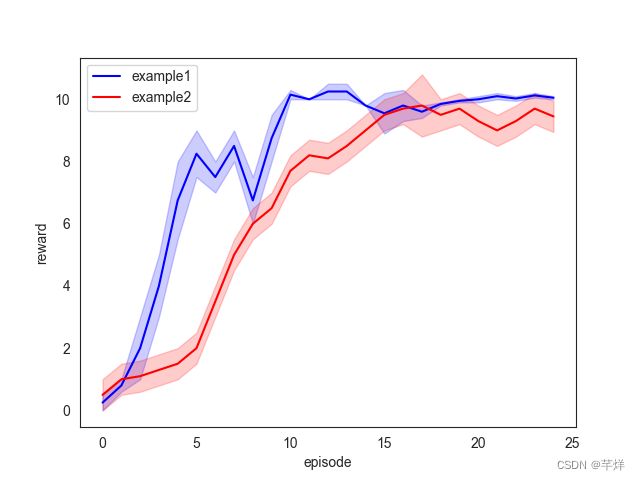


 113
113

 被折叠的 条评论
为什么被折叠?
被折叠的 条评论
为什么被折叠?
 到【灌水乐园】发言


