


Matplot++ 是一个基于 C++ 的绘图库,专门用于绘制高质量的数据图表。它提供了一个简洁而强大的接口,使得用户能够轻松地创建各种类型的图表,包括线图、散点图、柱状图、饼图等。Matplot++ 的设计目标是提供与 MATLAB 相似的绘图体验,同时利用 C++ 的性能和灵活性。(这个和隔壁的matplotlib-cpp不是一个库哦,matplot++是纯C++的绘图库)。
我们创建一个C++的控制台项目。
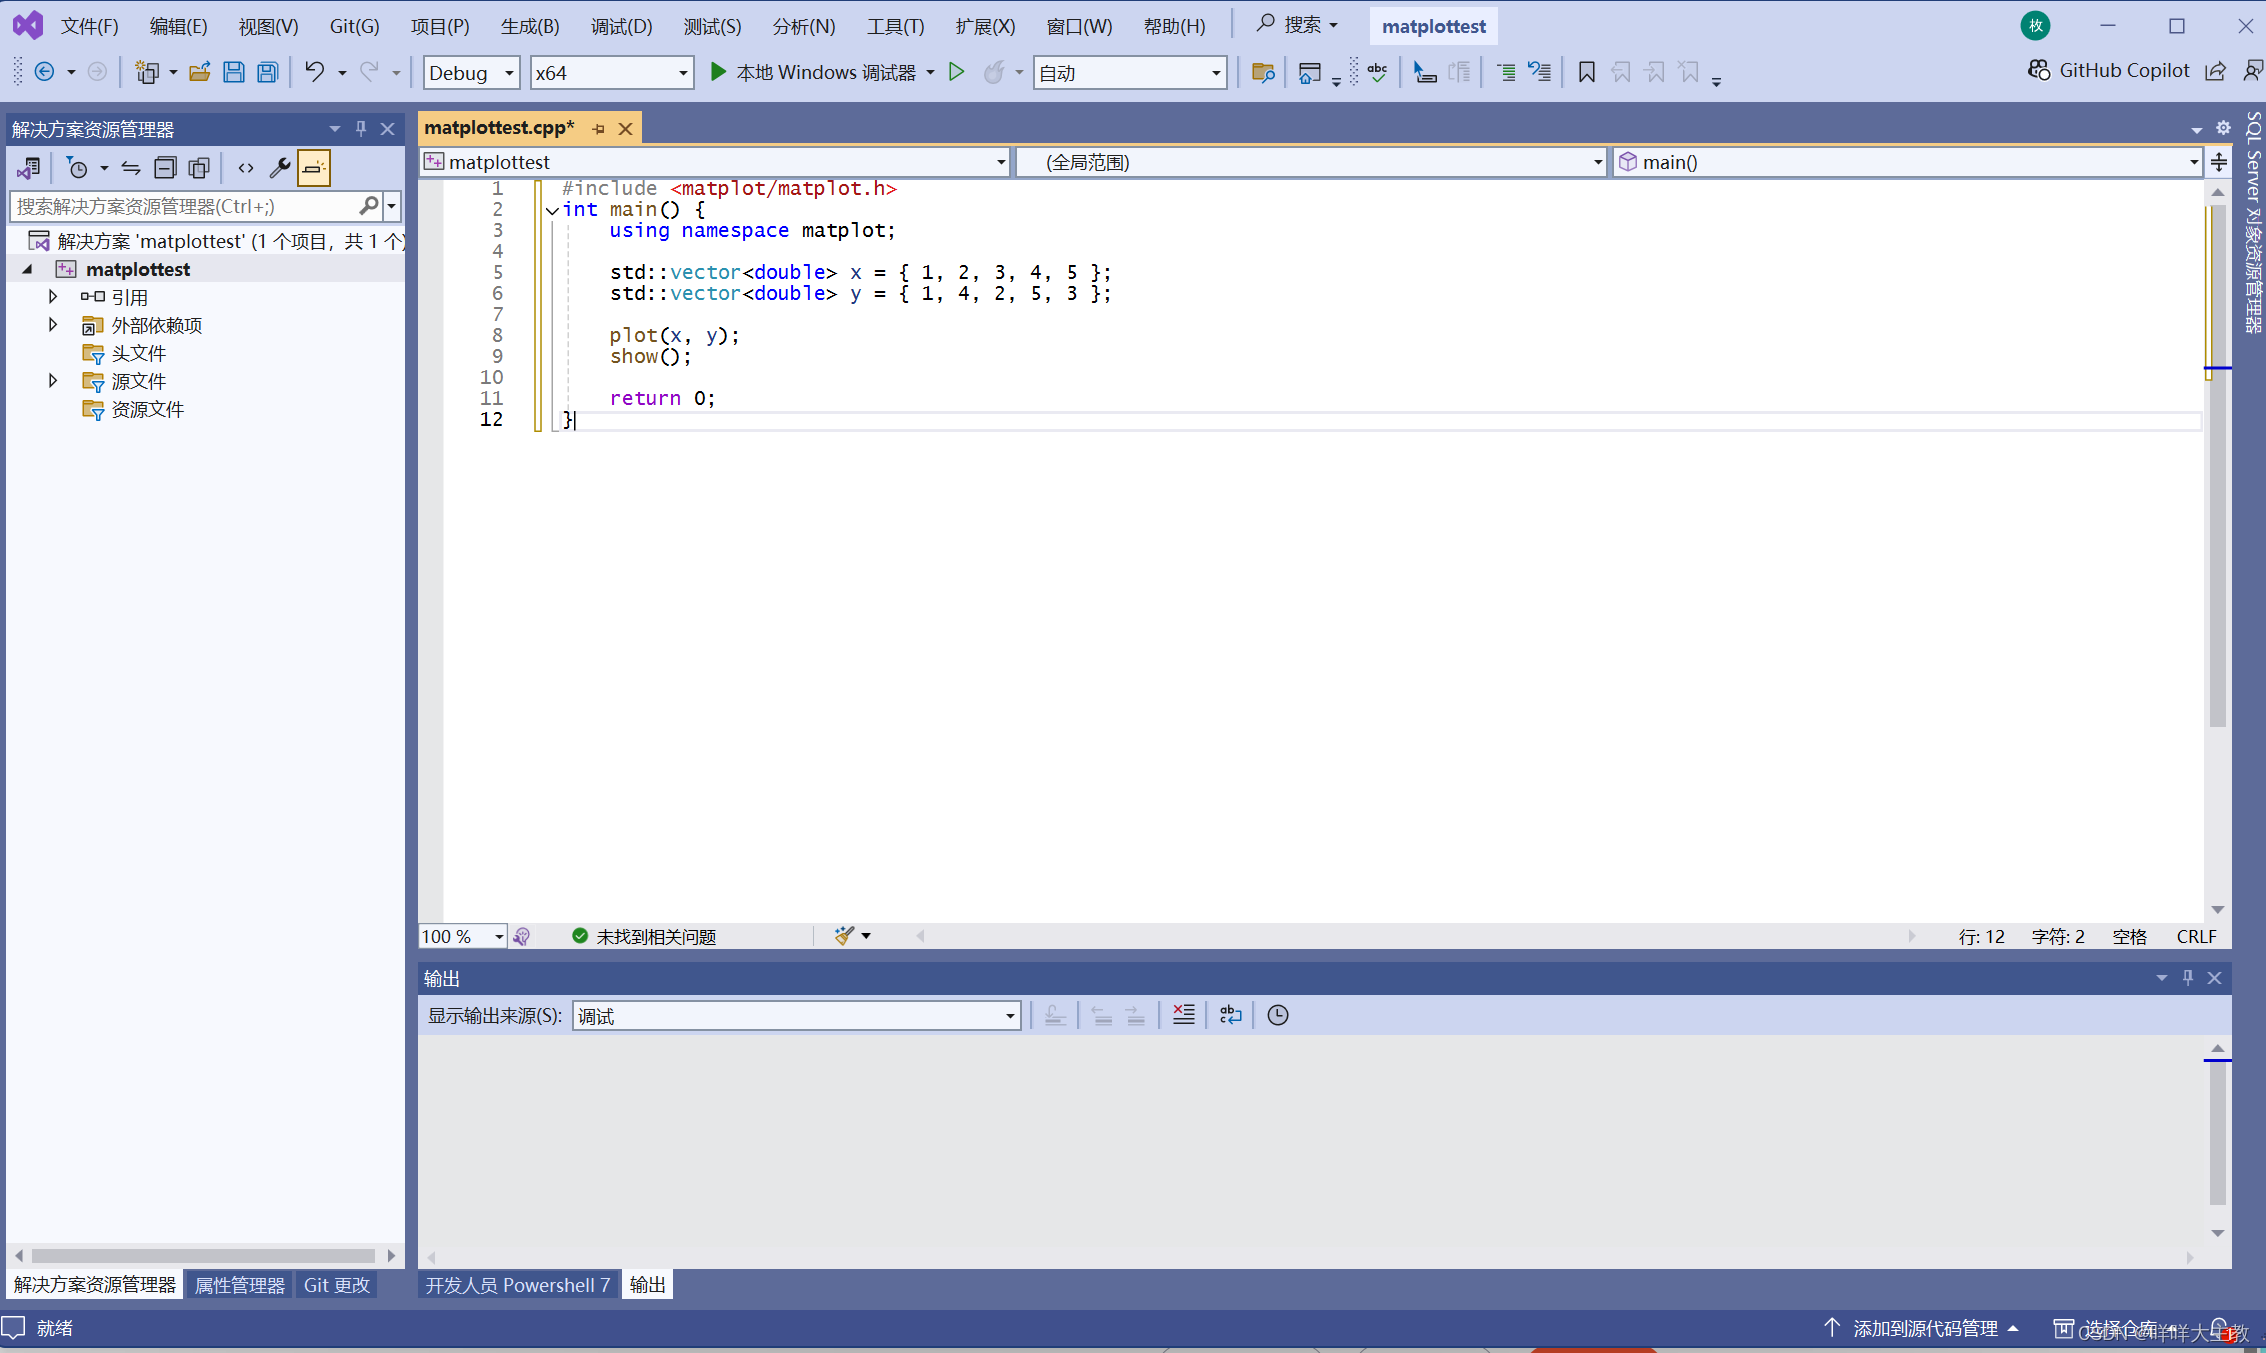
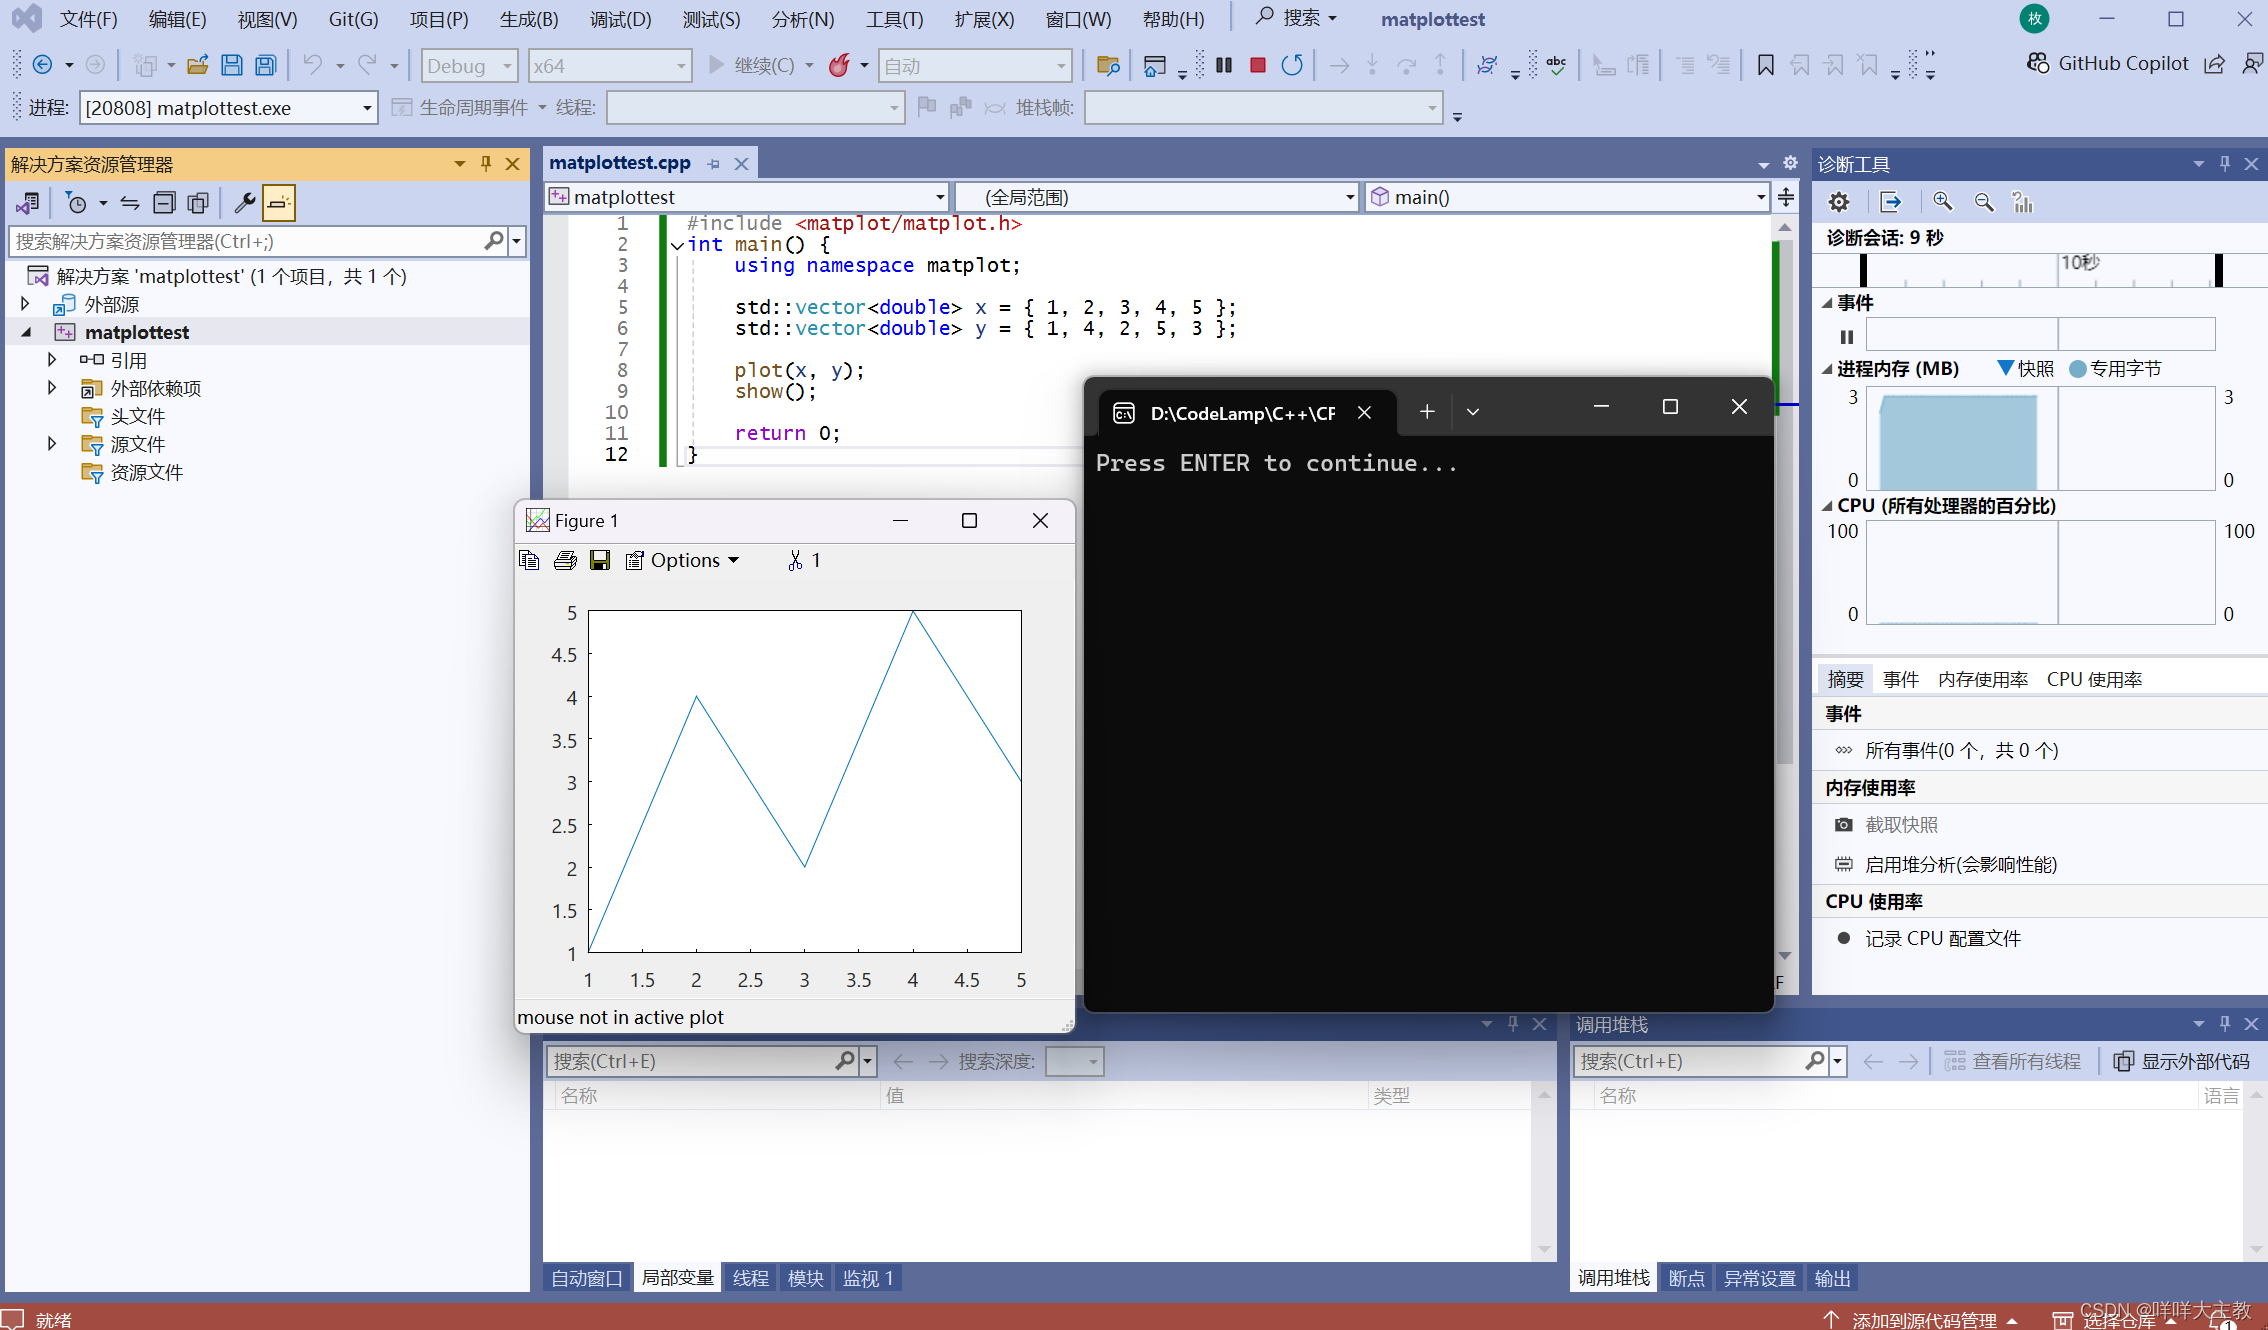
#include <matplot/matplot.h>
int main() {
    using namespace matplot;

    std::vector<double> x = { 1, 2, 3, 4, 5 };
    std::vector<double> y = { 1, 4, 2, 5, 3 };

    plot(x, y);
    show();

    return 0;
}
复制代码并运行然后就报错了。
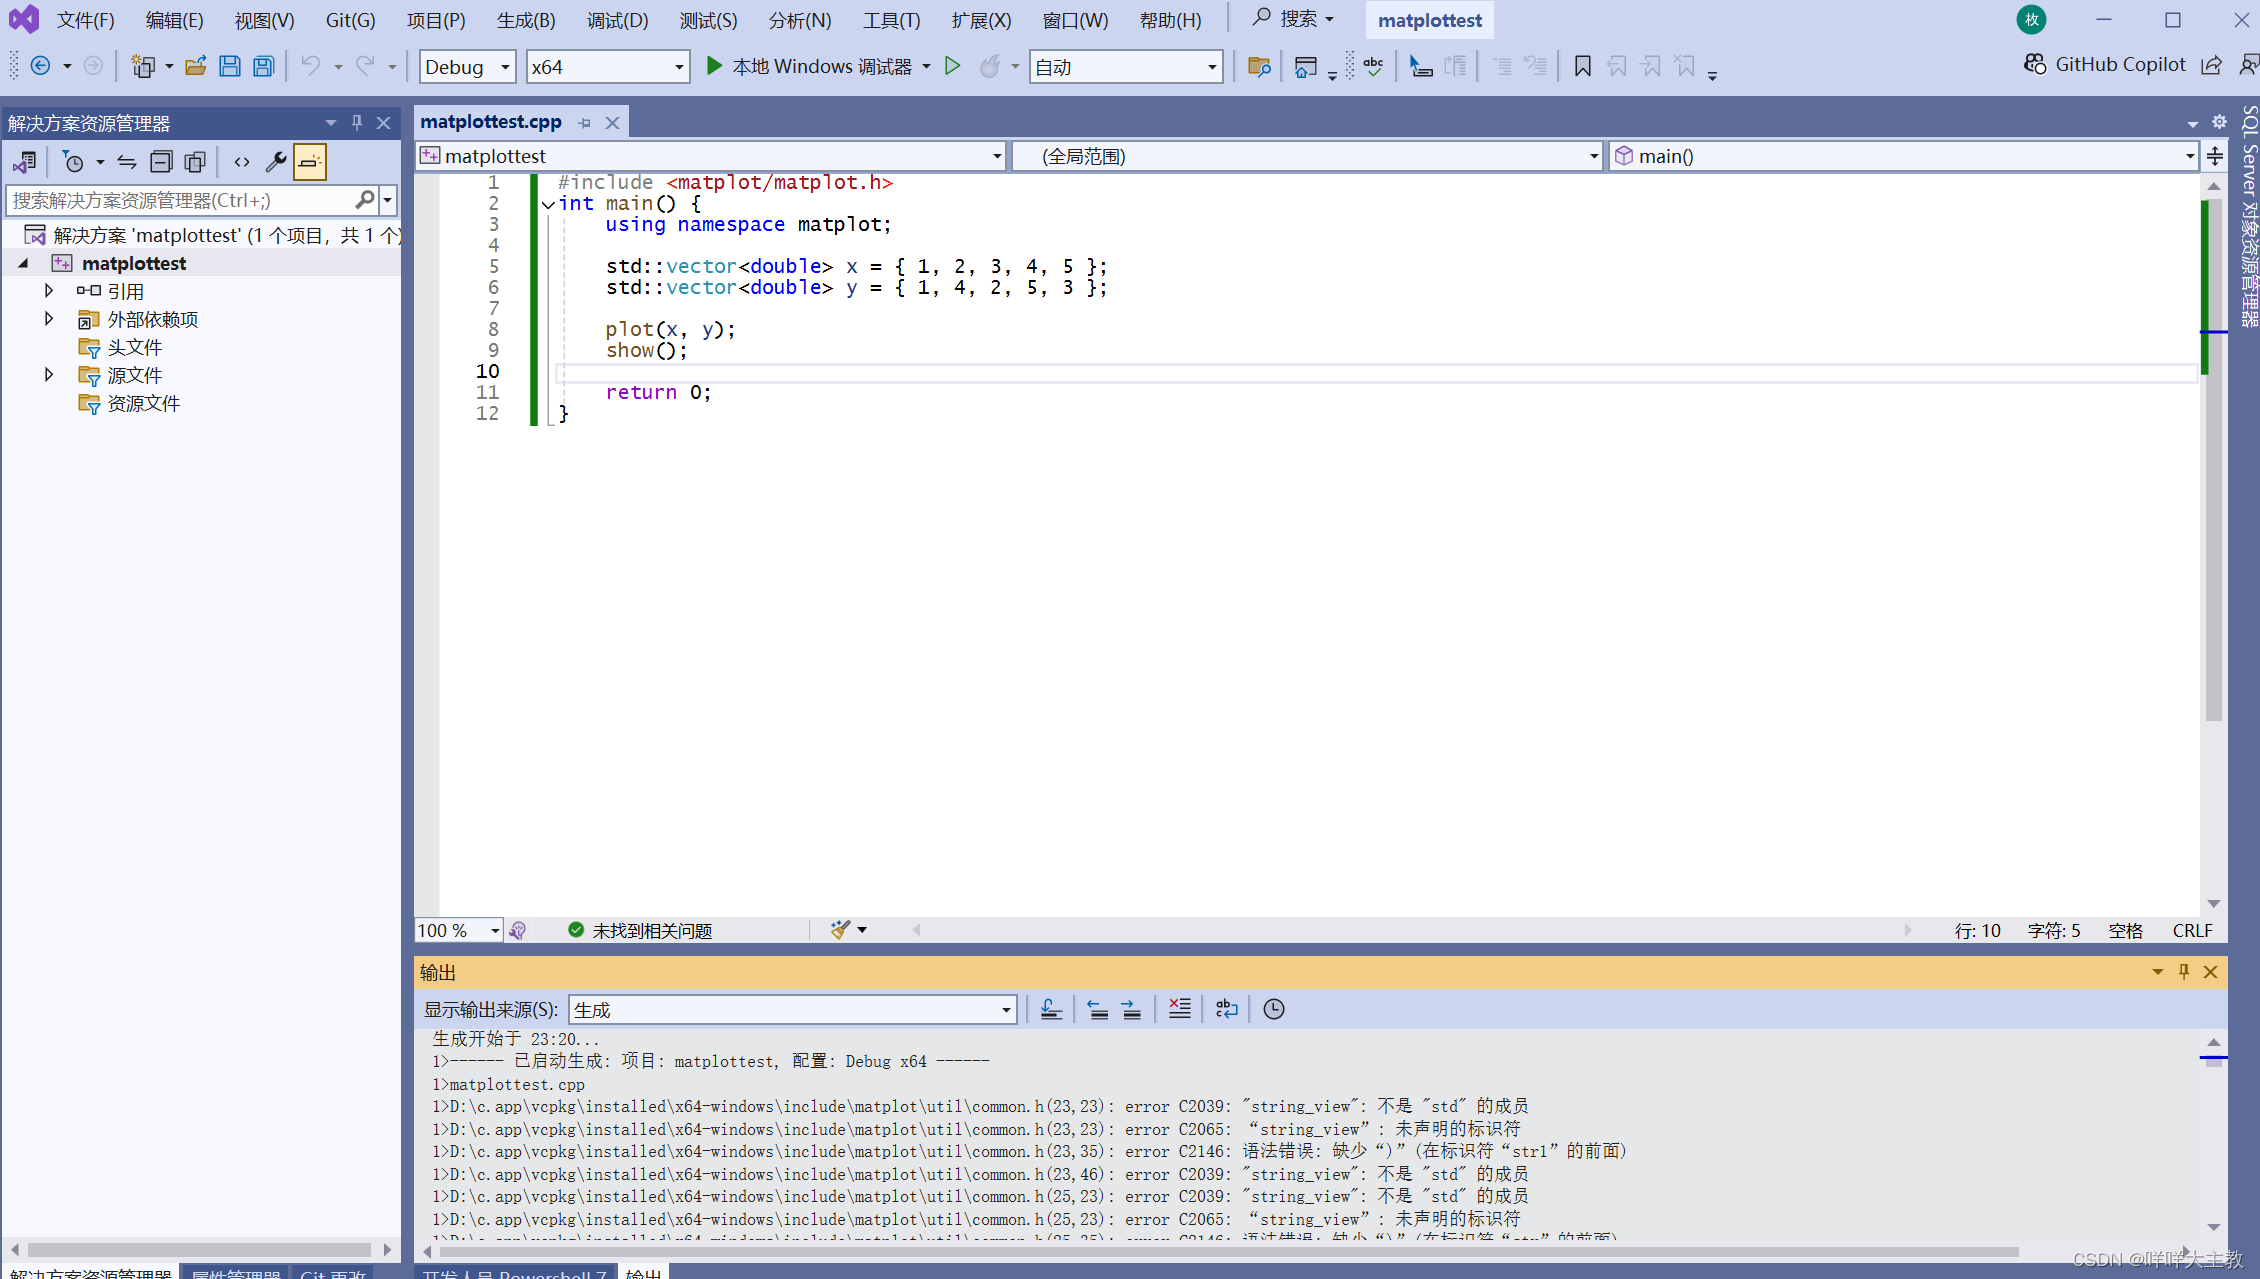
1>D:\c.app\vcpkg\installed\x64-windows\include\matplot\util\common.h(23,23): error C2039: "string_view": 不是 "std" 的成员
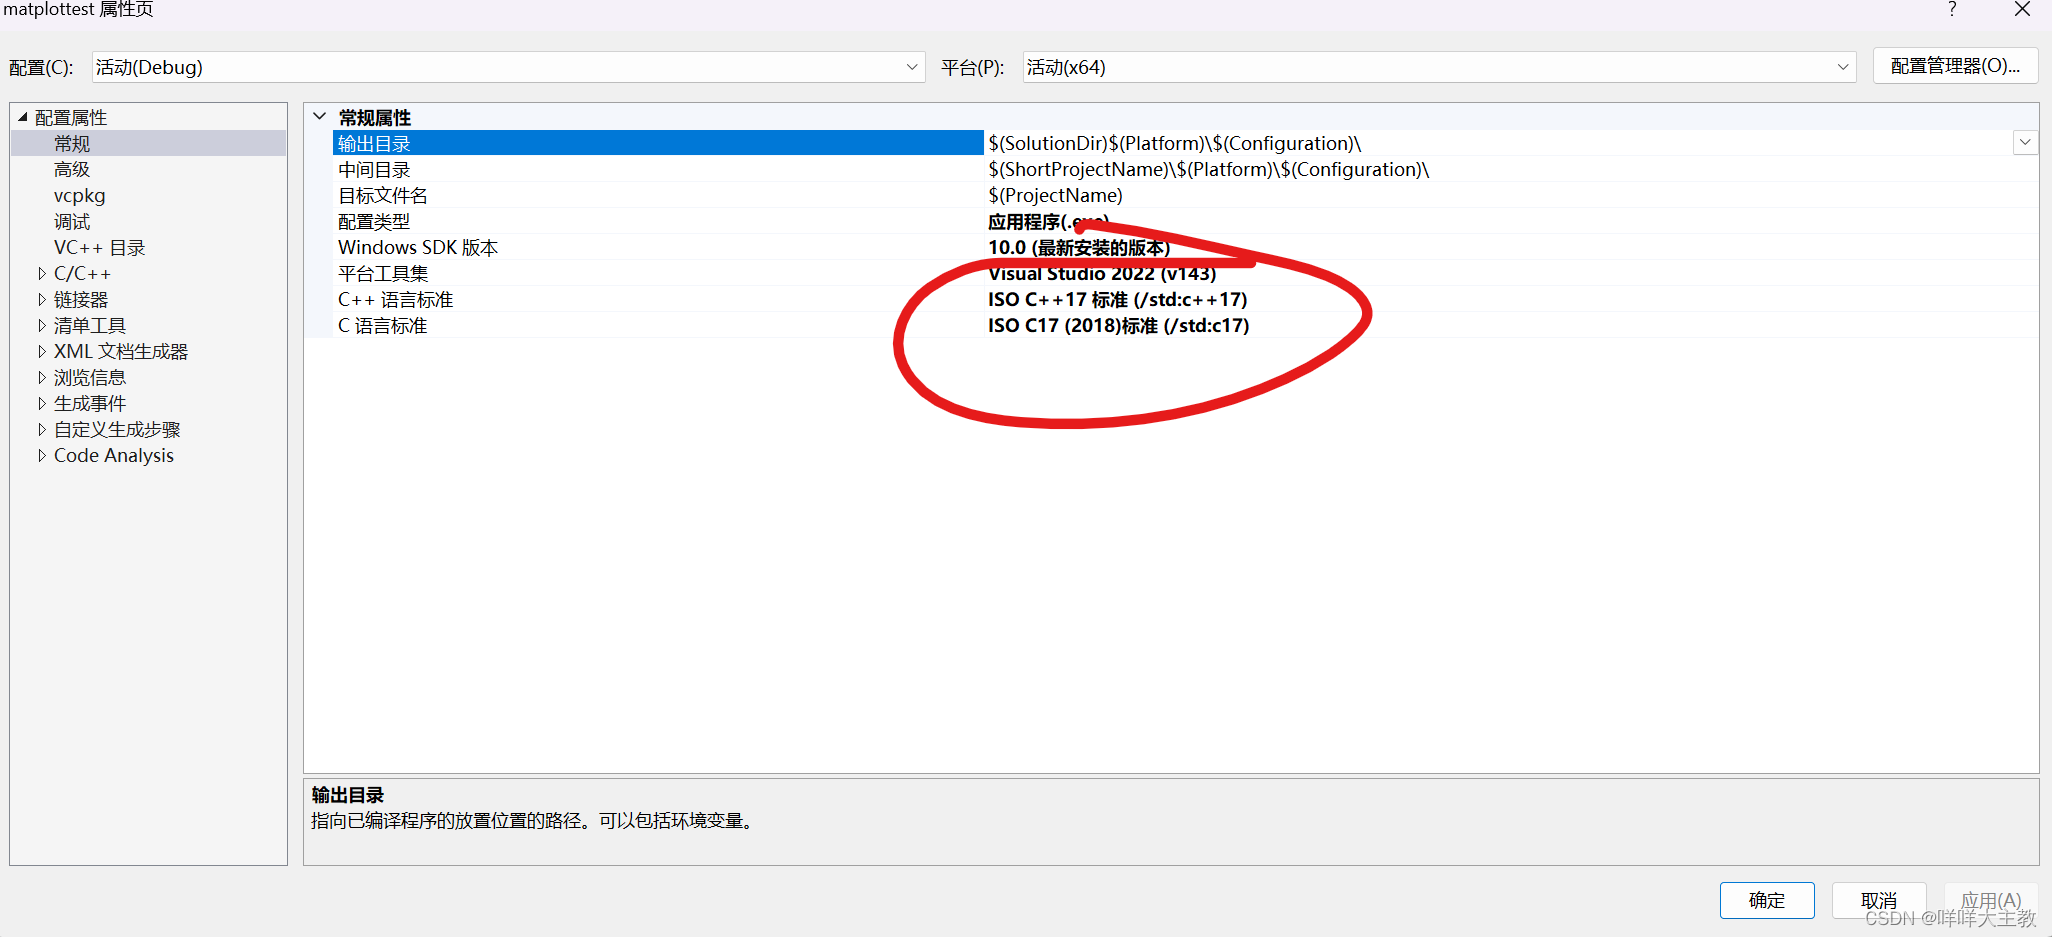
1>D:\c.app\vcpkg\installed\x64-windows\include\matplot\util\common.h(23,23): error C2065: “string_view”: 未声明的标识符这是由于这个库不支持C++11版本,只支持C++17及以上的版本。
第二个问题,空指针异常。
Unhandled exception at 0x00007FFE9ECECF19 in MatplotPlusPlus__test.exe:
Microsoft C++ exception: std::runtime_error at memory location 0x000000F632EFEC68.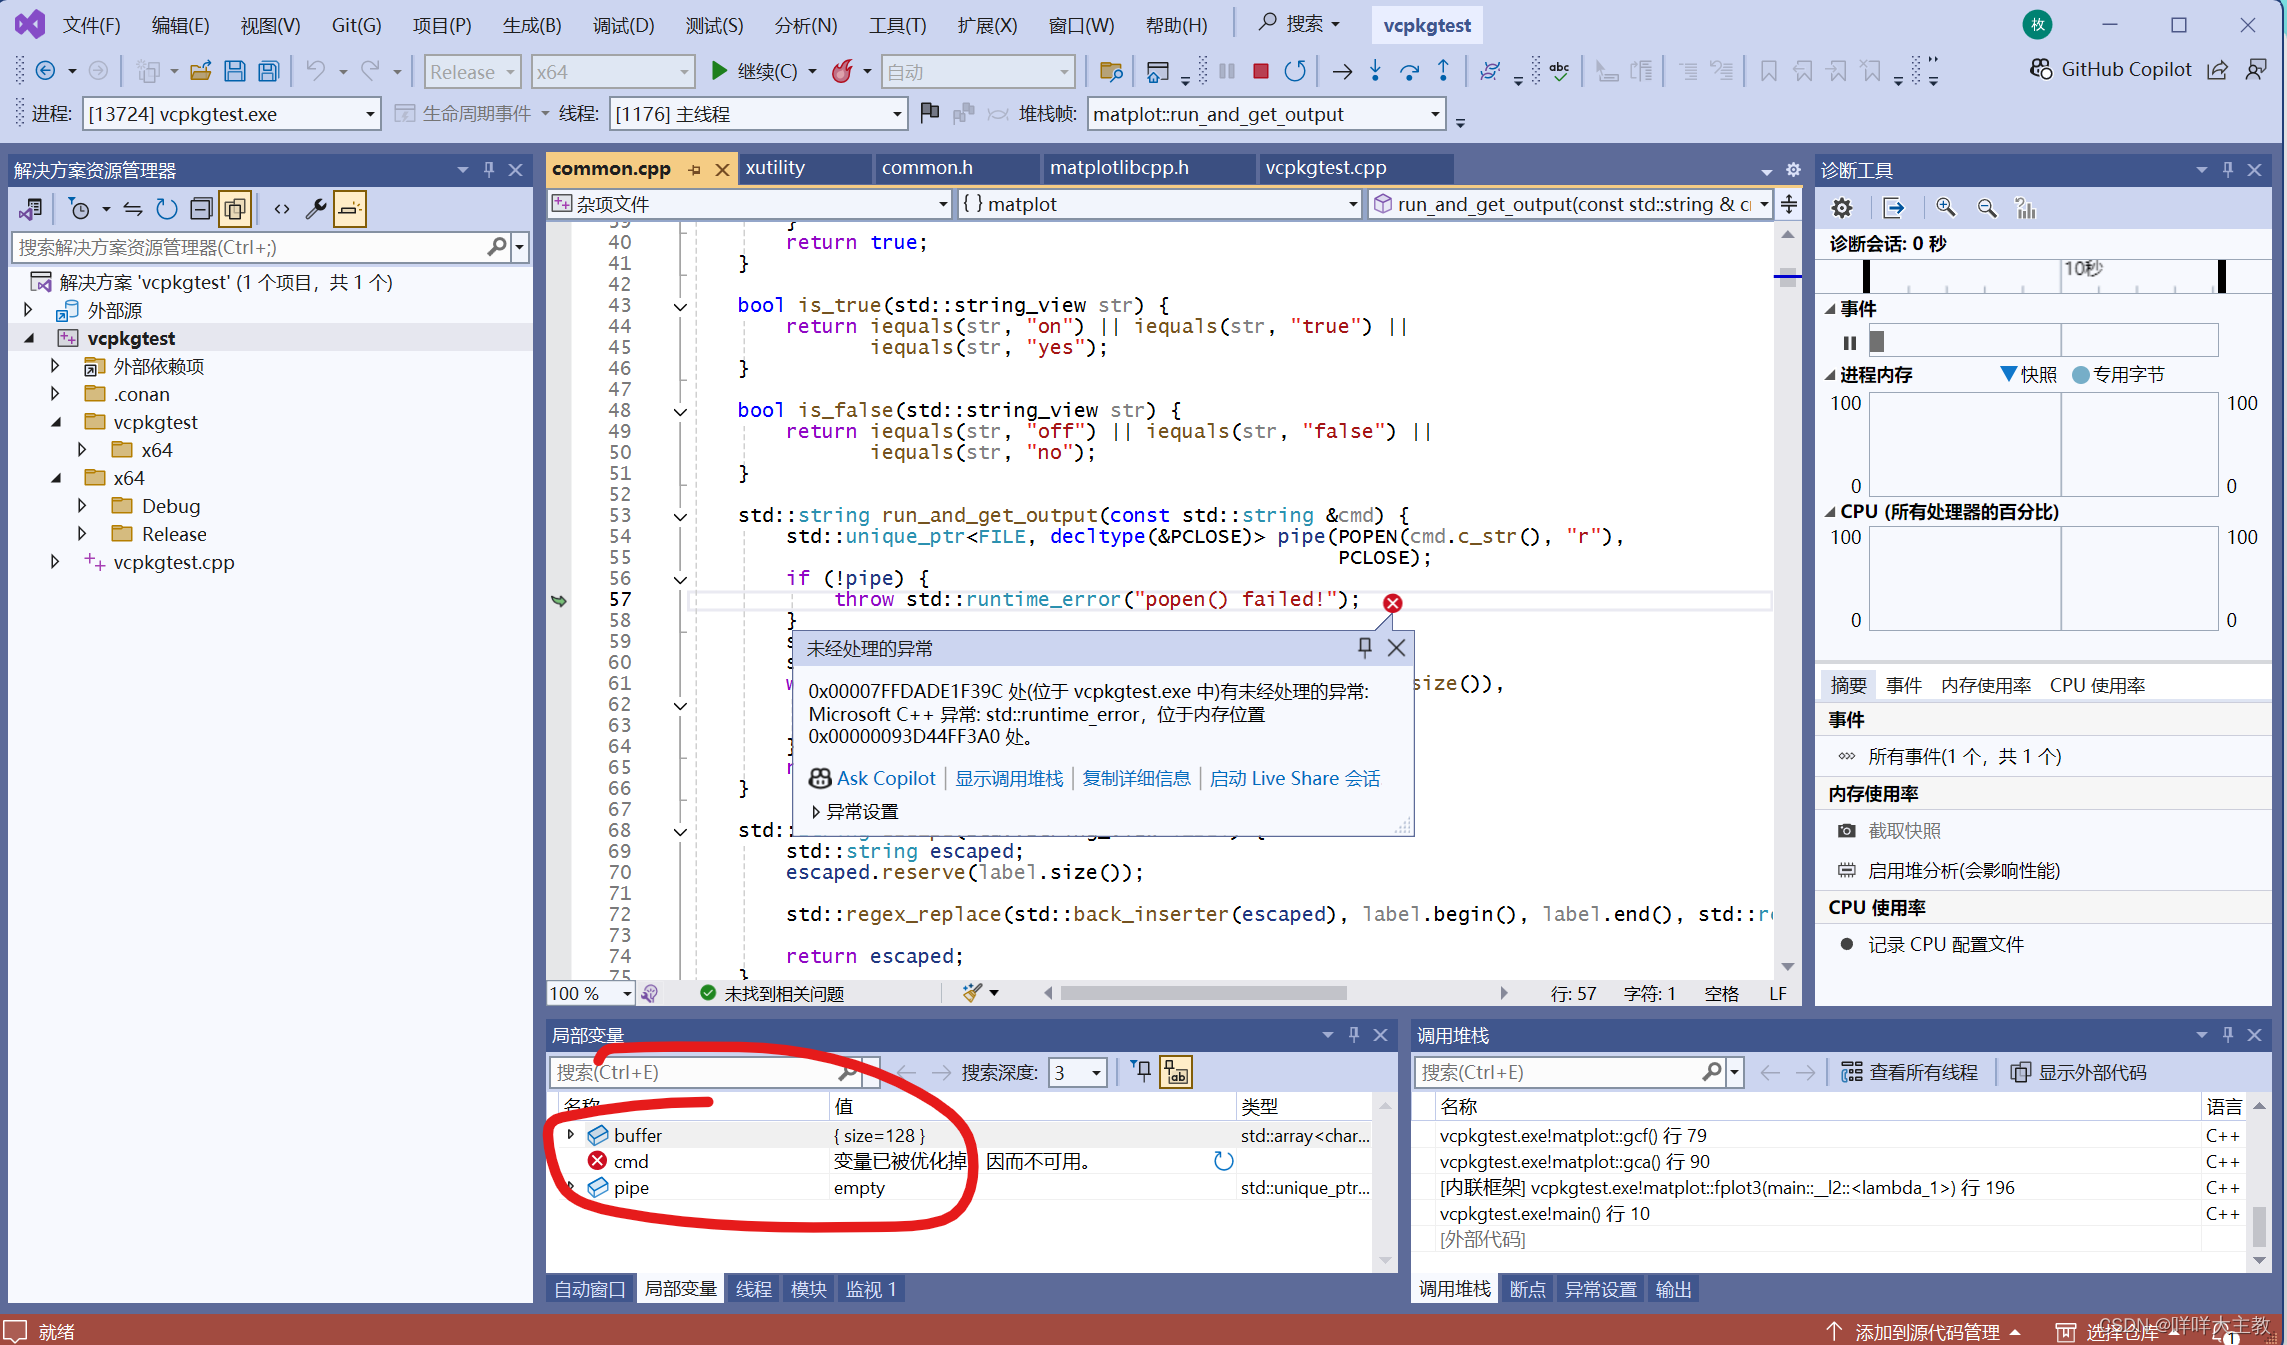
这个问题是因为matplot++这个库的绘图功能是依赖于gunplot这个库的,gunplot相当方便安装,只需要下载.exe文件,然后安装就可以了。
gnuplot - Browse /gnuplot/6.0.1 at SourceForge.net
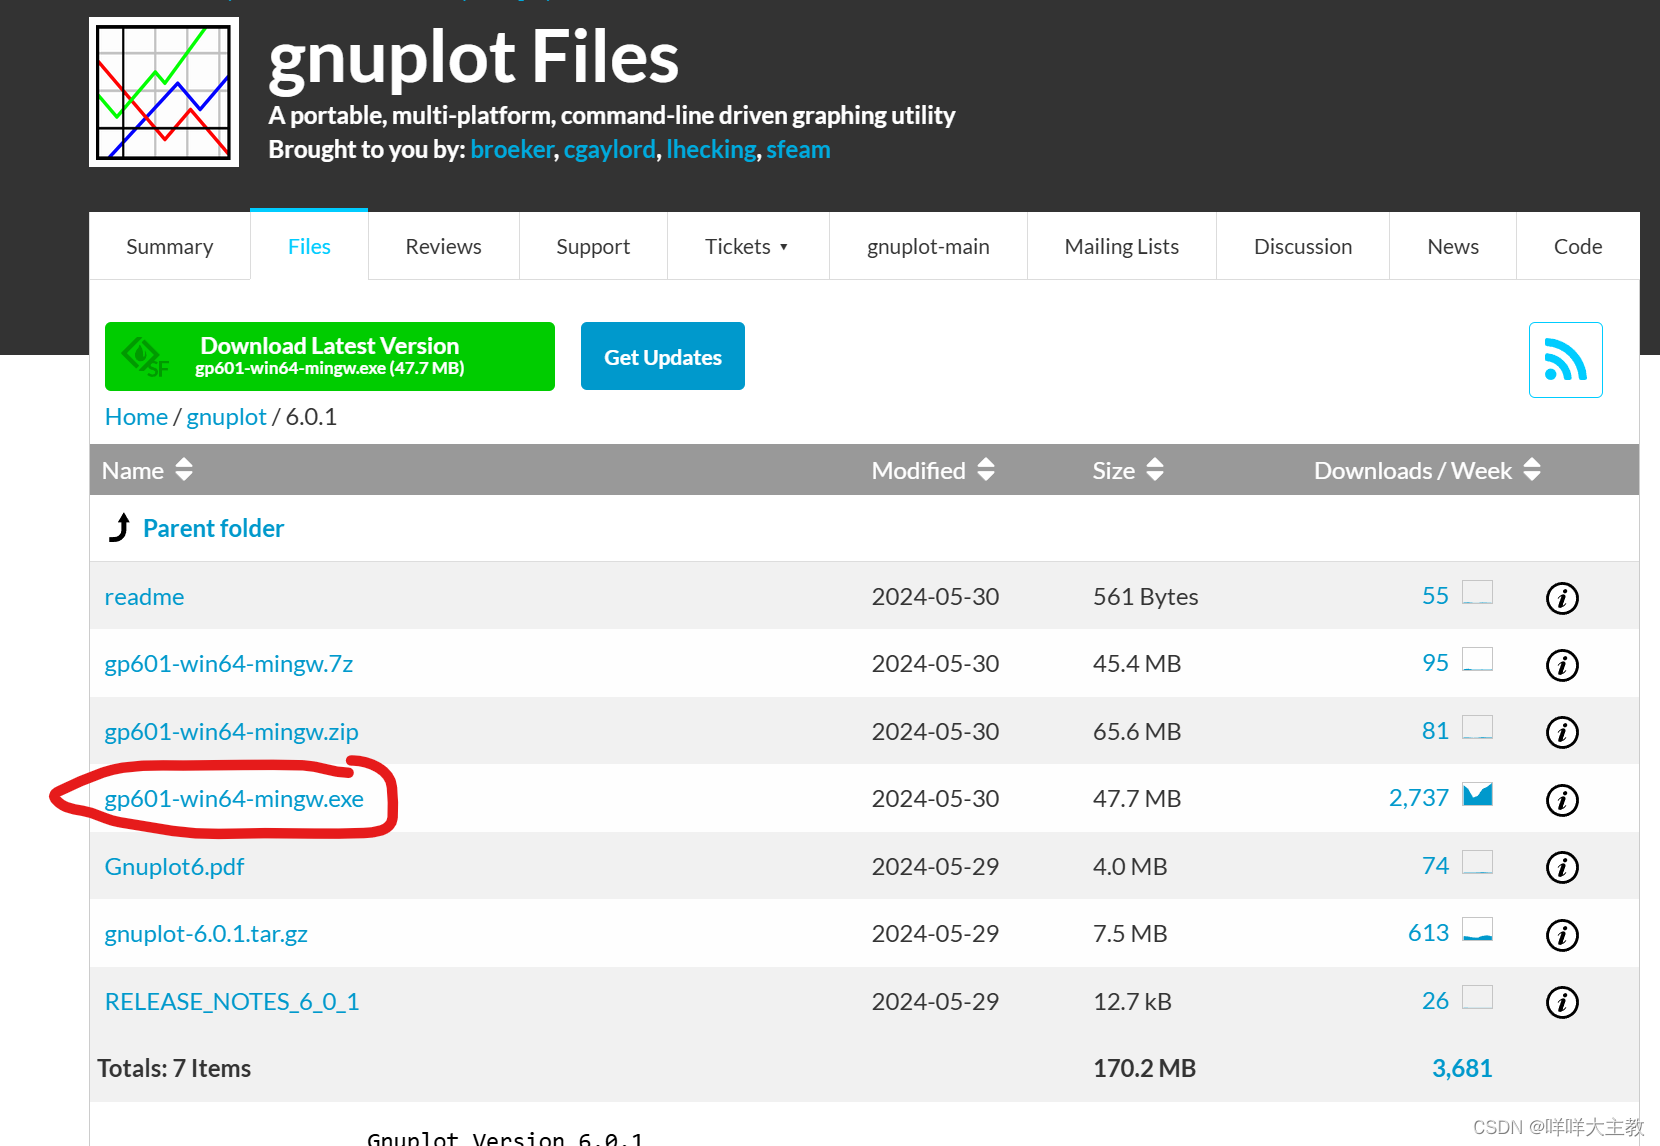
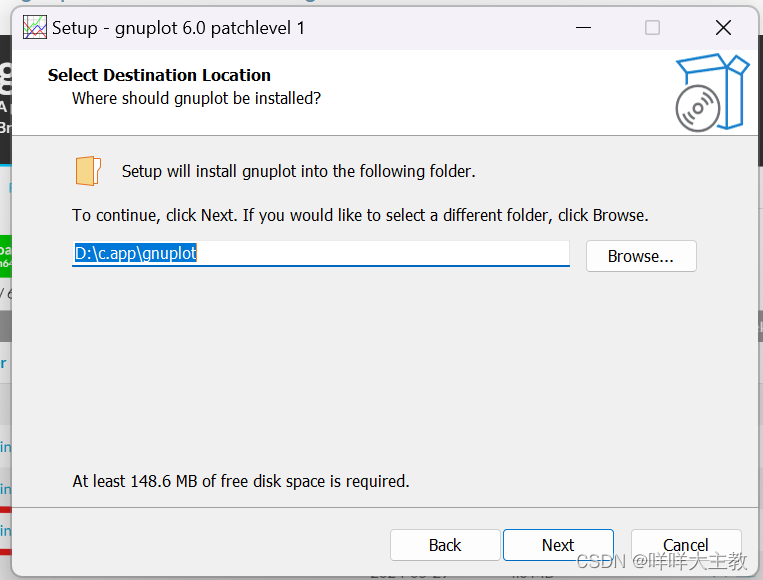
自己定义好安装路径然后下一步安装就可以了。
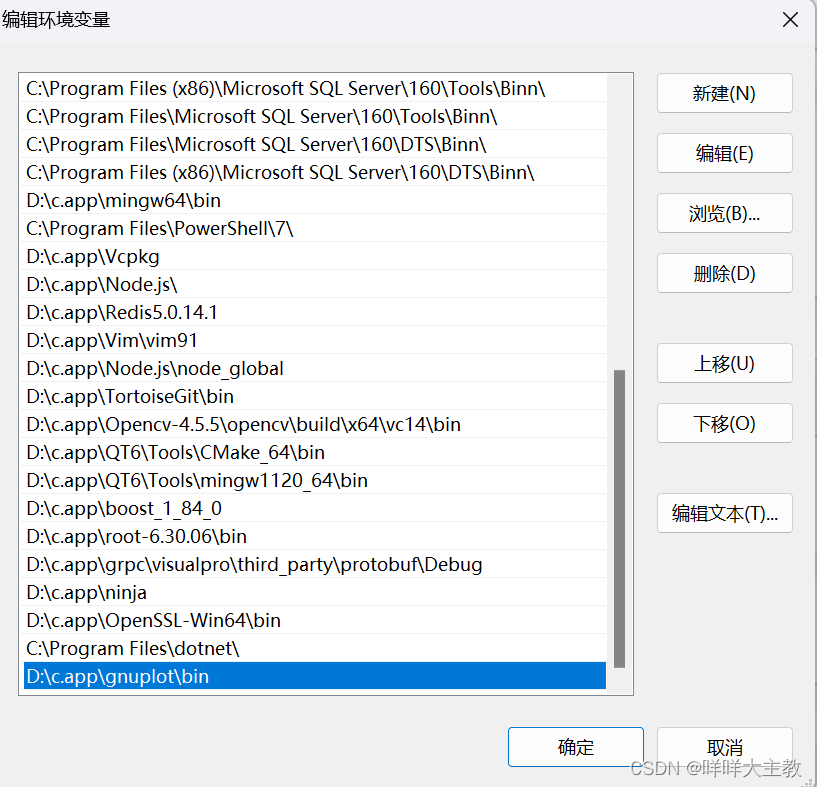
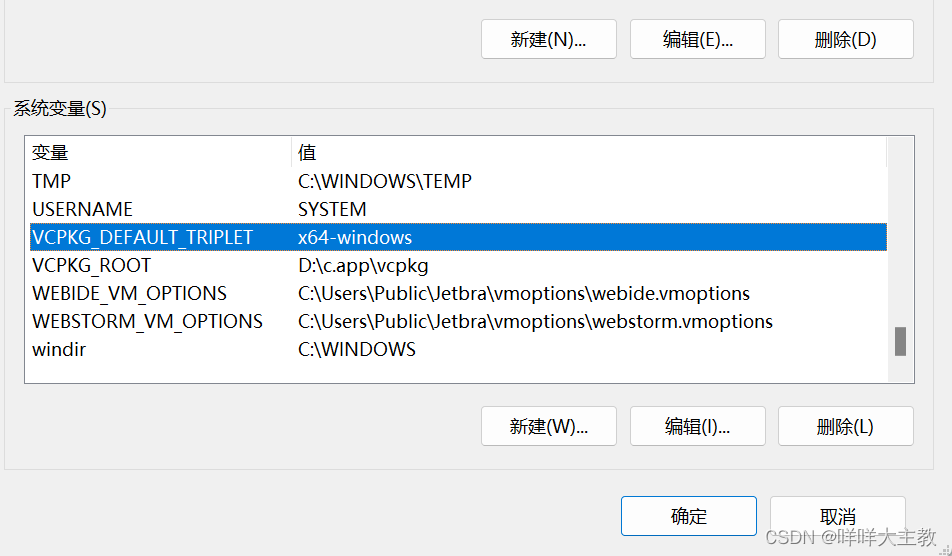
将gnuplot的.exe文件加入到系统环境变量Path中。

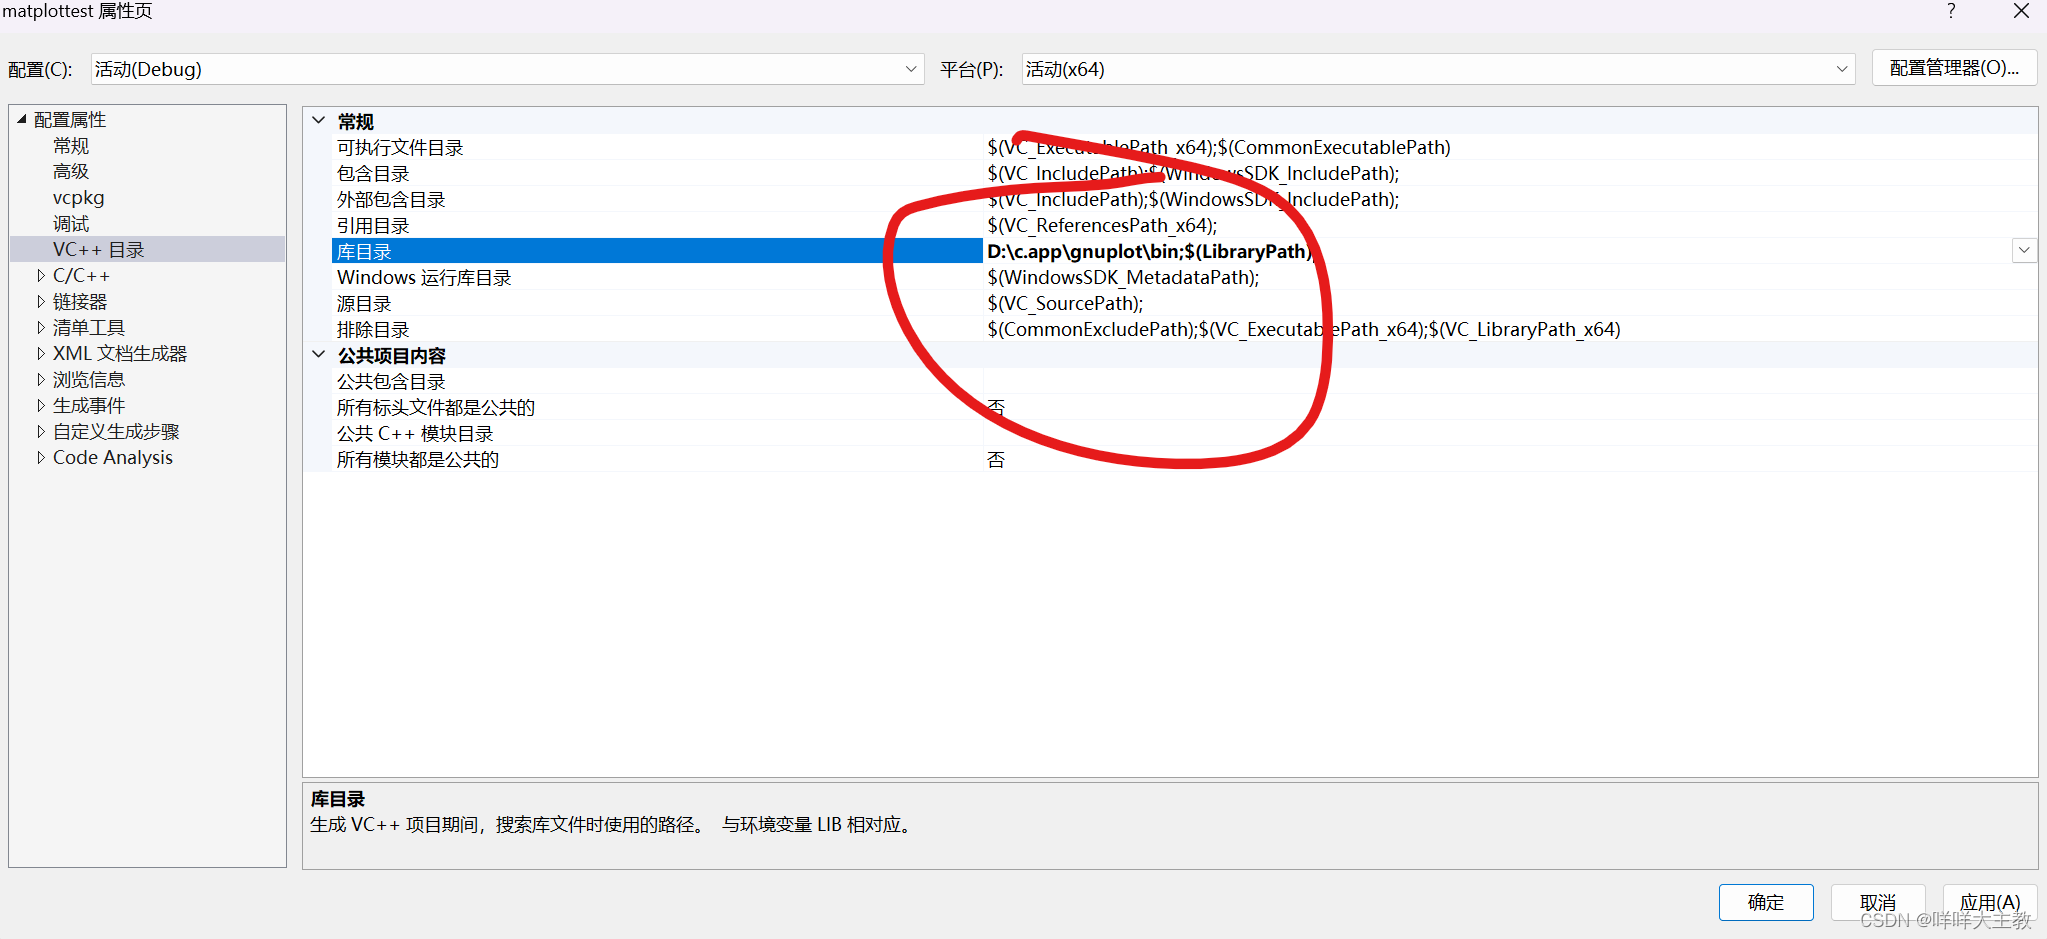
再将gnuplot的链接库文件导入到VS2022中。
你们也注意到了,博主没有在VS2022中导入matplot++这个库的库文件和头文件,但是程序运行可以通过,这是因为博主使用了Vcpkg安装matplot++,Vcpkg自动将这个库的头文件路径和库文件路径集成到了VS2022中,因此不需要手动导入。Vcpgk自动生成了一个系统环境变量,这个变量里面的路径就是matplot++的路径,VS2022可以自动找到这个路径里面的库。如何用Vcpkg安装库,大家可以看我之前的博客哦,说的非常详细。
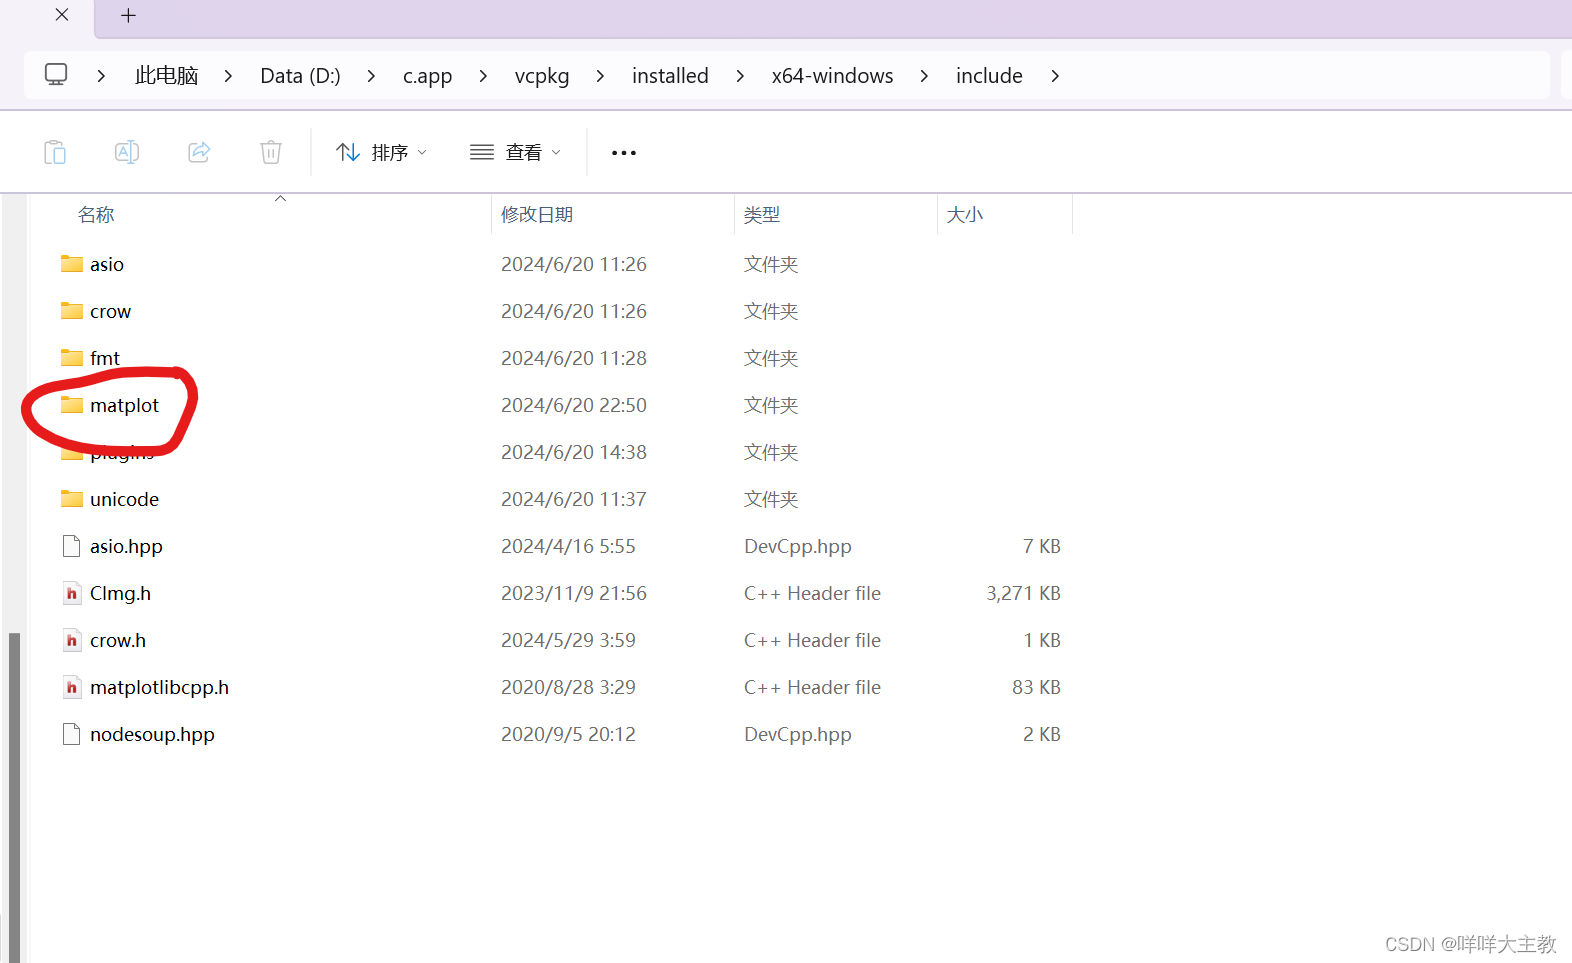
打开路径就可以看到库的头文件目录了。
再次运行代码,成功绘制图形。
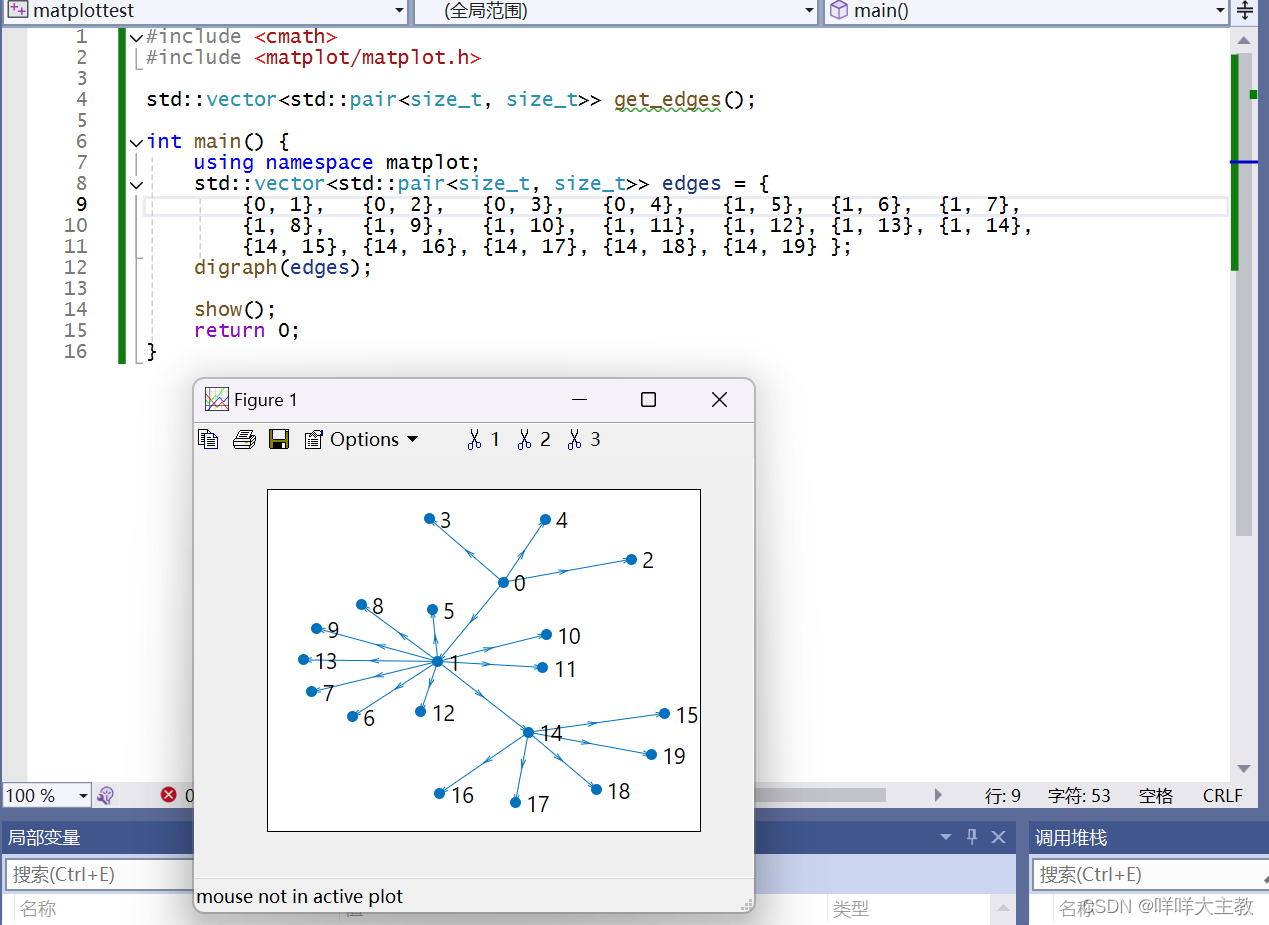
matplot++可以绘制非常多种类的图形,详情见官网Home - Matplot++
#include <cmath>
#include <matplot/matplot.h>

std::vector<std::pair<size_t, size_t>> get_edges();

int main() {
    using namespace matplot;
    std::vector<std::pair<size_t, size_t>> edges = {
        {0, 1},   {0, 2},   {0, 3},   {0, 4},   {1, 5},  {1, 6},  {1, 7},
        {1, 8},   {1, 9},   {1, 10},  {1, 11},  {1, 12}, {1, 13}, {1, 14},
        {14, 15}, {14, 16}, {14, 17}, {14, 18}, {14, 19} };
    digraph(edges);

    show();
    return 0;
} 
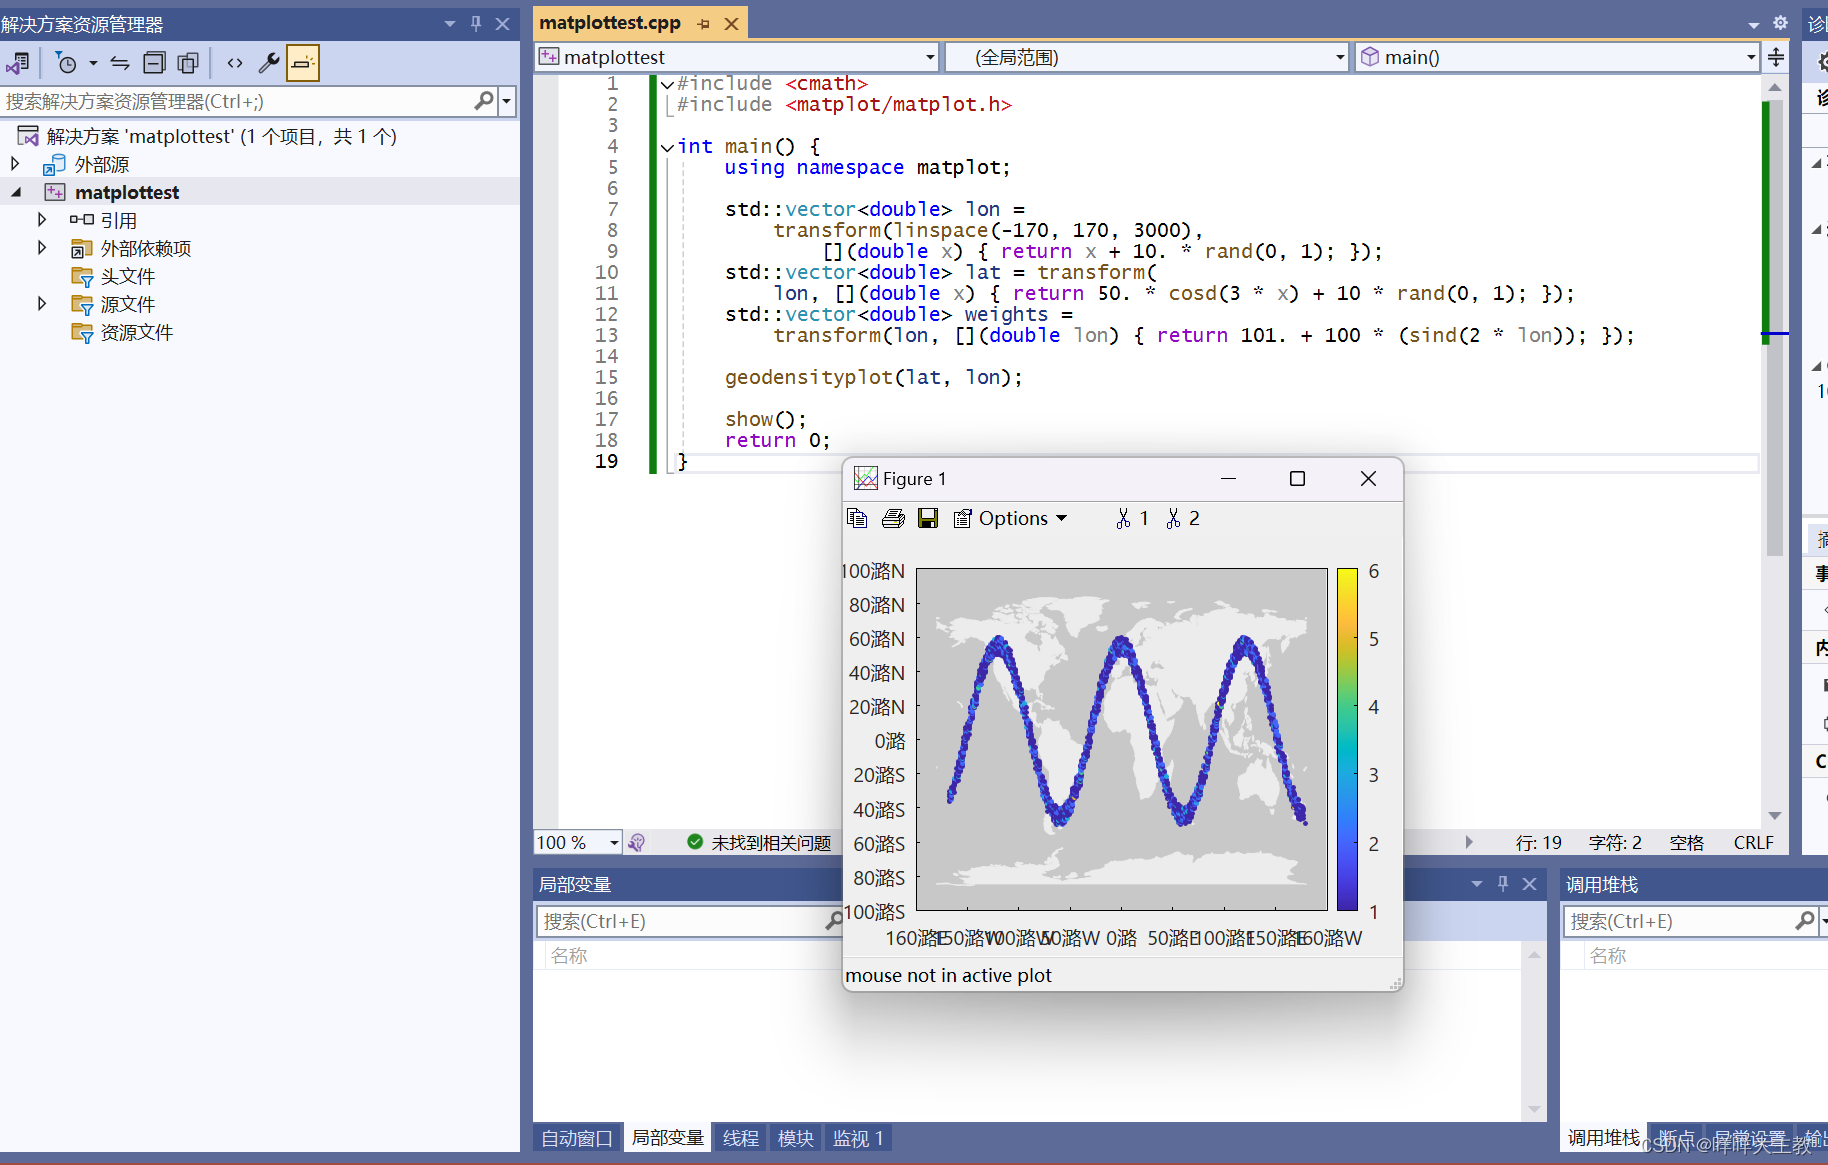
#include <cmath>
#include <matplot/matplot.h>

int main() {
    using namespace matplot;

    std::vector<double> lon =
        transform(linspace(-170, 170, 3000),
            [](double x) { return x + 10. * rand(0, 1); });
    std::vector<double> lat = transform(
        lon, [](double x) { return 50. * cosd(3 * x) + 10 * rand(0, 1); });
    std::vector<double> weights =
        transform(lon, [](double lon) { return 101. + 100 * (sind(2 * lon)); });

    geodensityplot(lat, lon);

    show();
    return 0;
}
哈哈哈,下面这个图乱码了 ,可能是编码格式的问题,无伤大雅!。
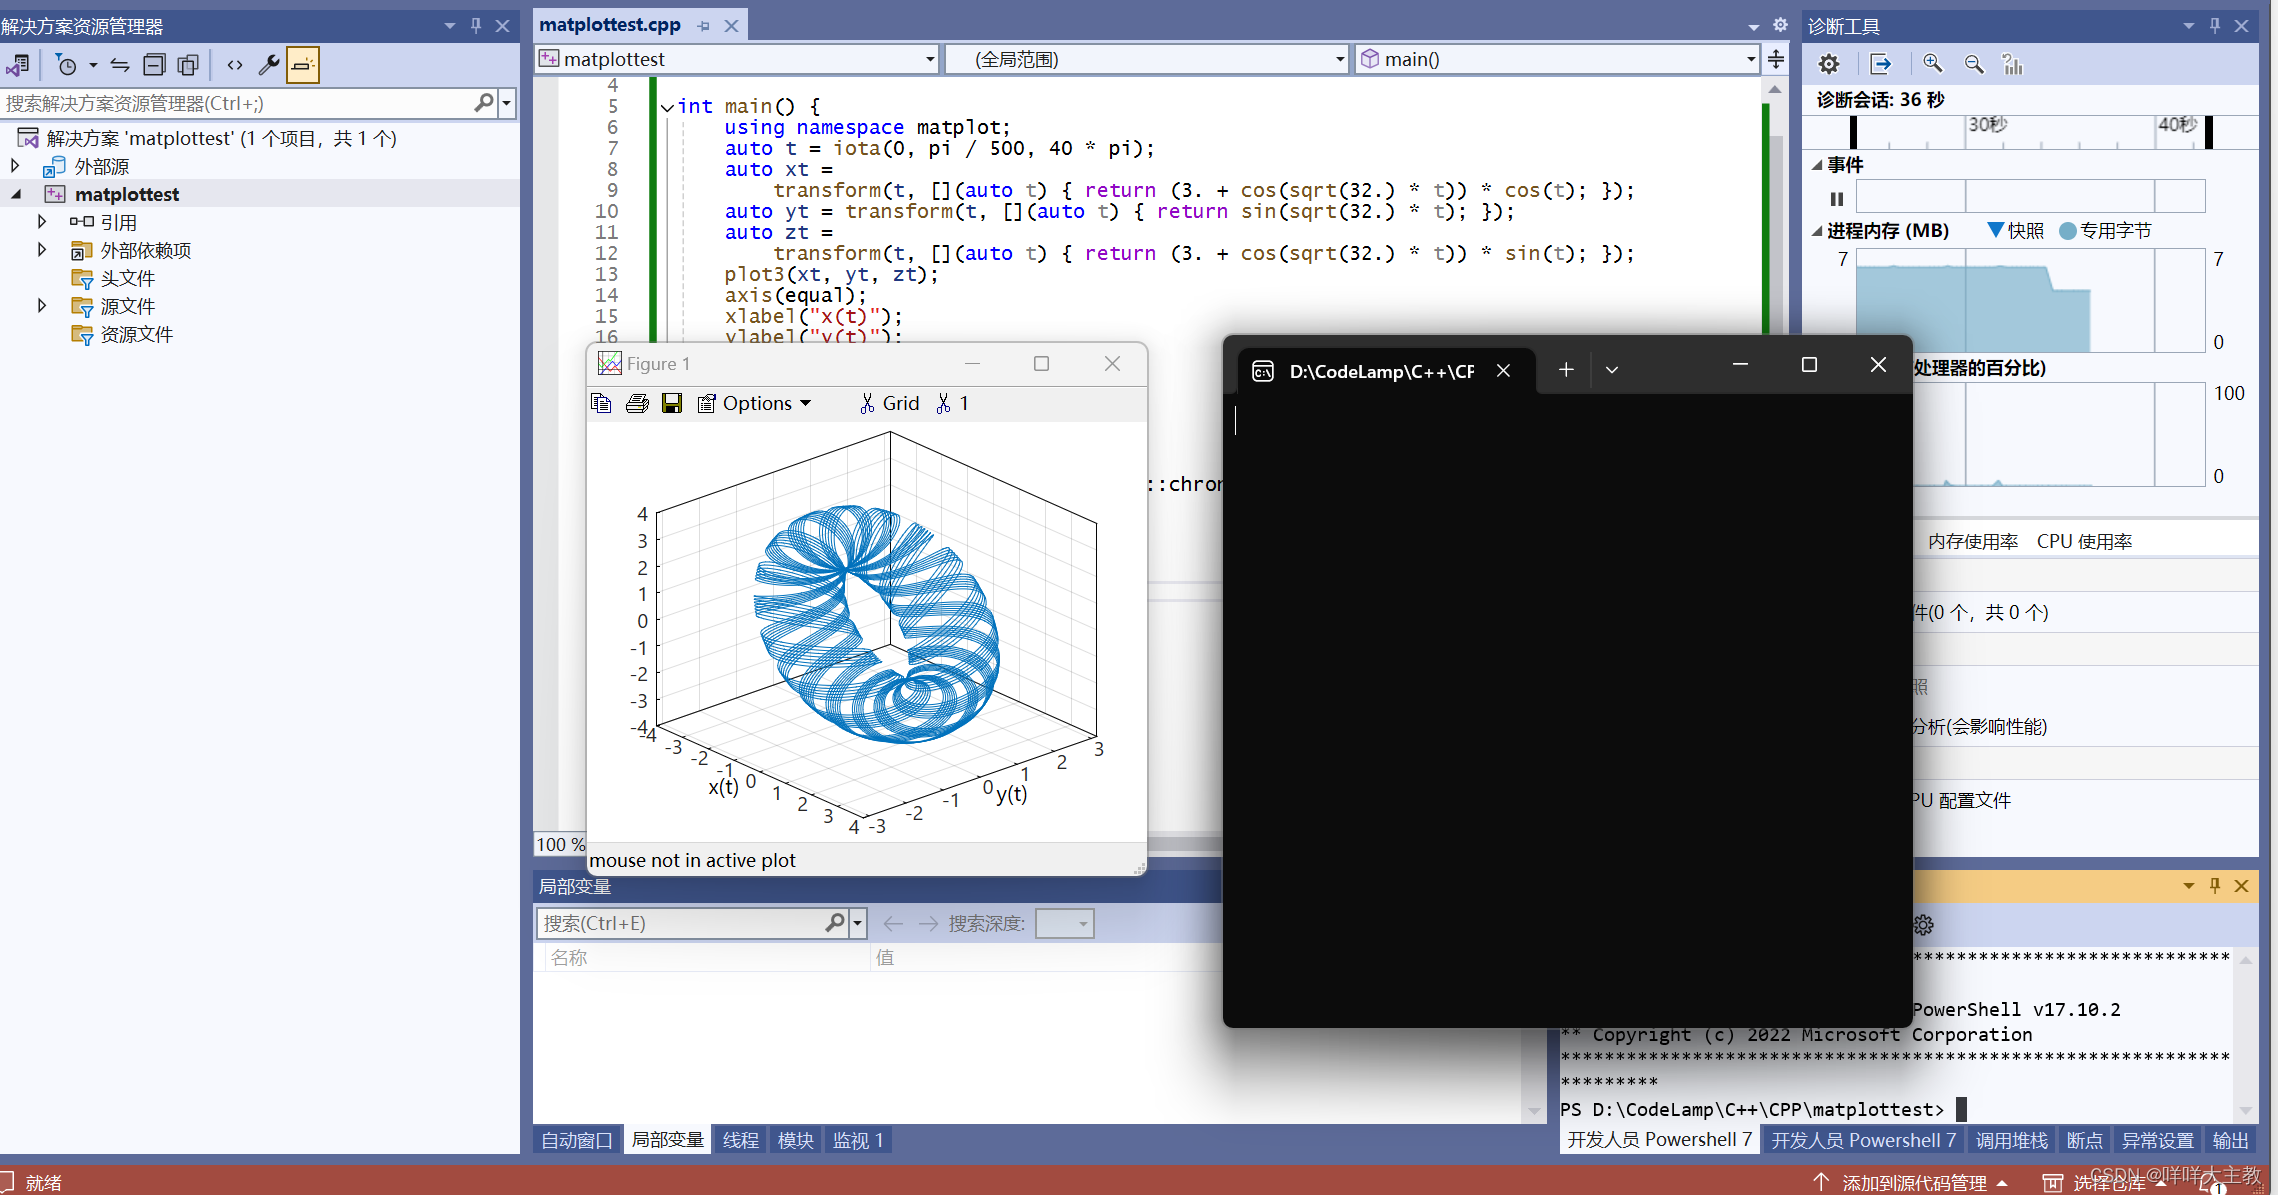
#include <cmath>
#include <matplot/matplot.h>
#include <thread>

int main() {
    using namespace matplot;
    auto t = iota(0, pi / 500, 40 * pi);
    auto xt =
        transform(t, [](auto t) { return (3. + cos(sqrt(32.) * t)) * cos(t); });
    auto yt = transform(t, [](auto t) { return sin(sqrt(32.) * t); });
    auto zt =
        transform(t, [](auto t) { return (3. + cos(sqrt(32.) * t)) * sin(t); });
    plot3(xt, yt, zt);
    axis(equal);
    xlabel("x(t)");
    ylabel("y(t)");
    zlabel("z(t)");

    auto ax = gca();
    float da = ax->azimuth();
    for (size_t i = 0; i <= 360; ++i) {
        ax->azimuth(da + 2 * i);
        std::this_thread::sleep_for(std::chrono::milliseconds(50));
    }

    show();
    return 0;
}
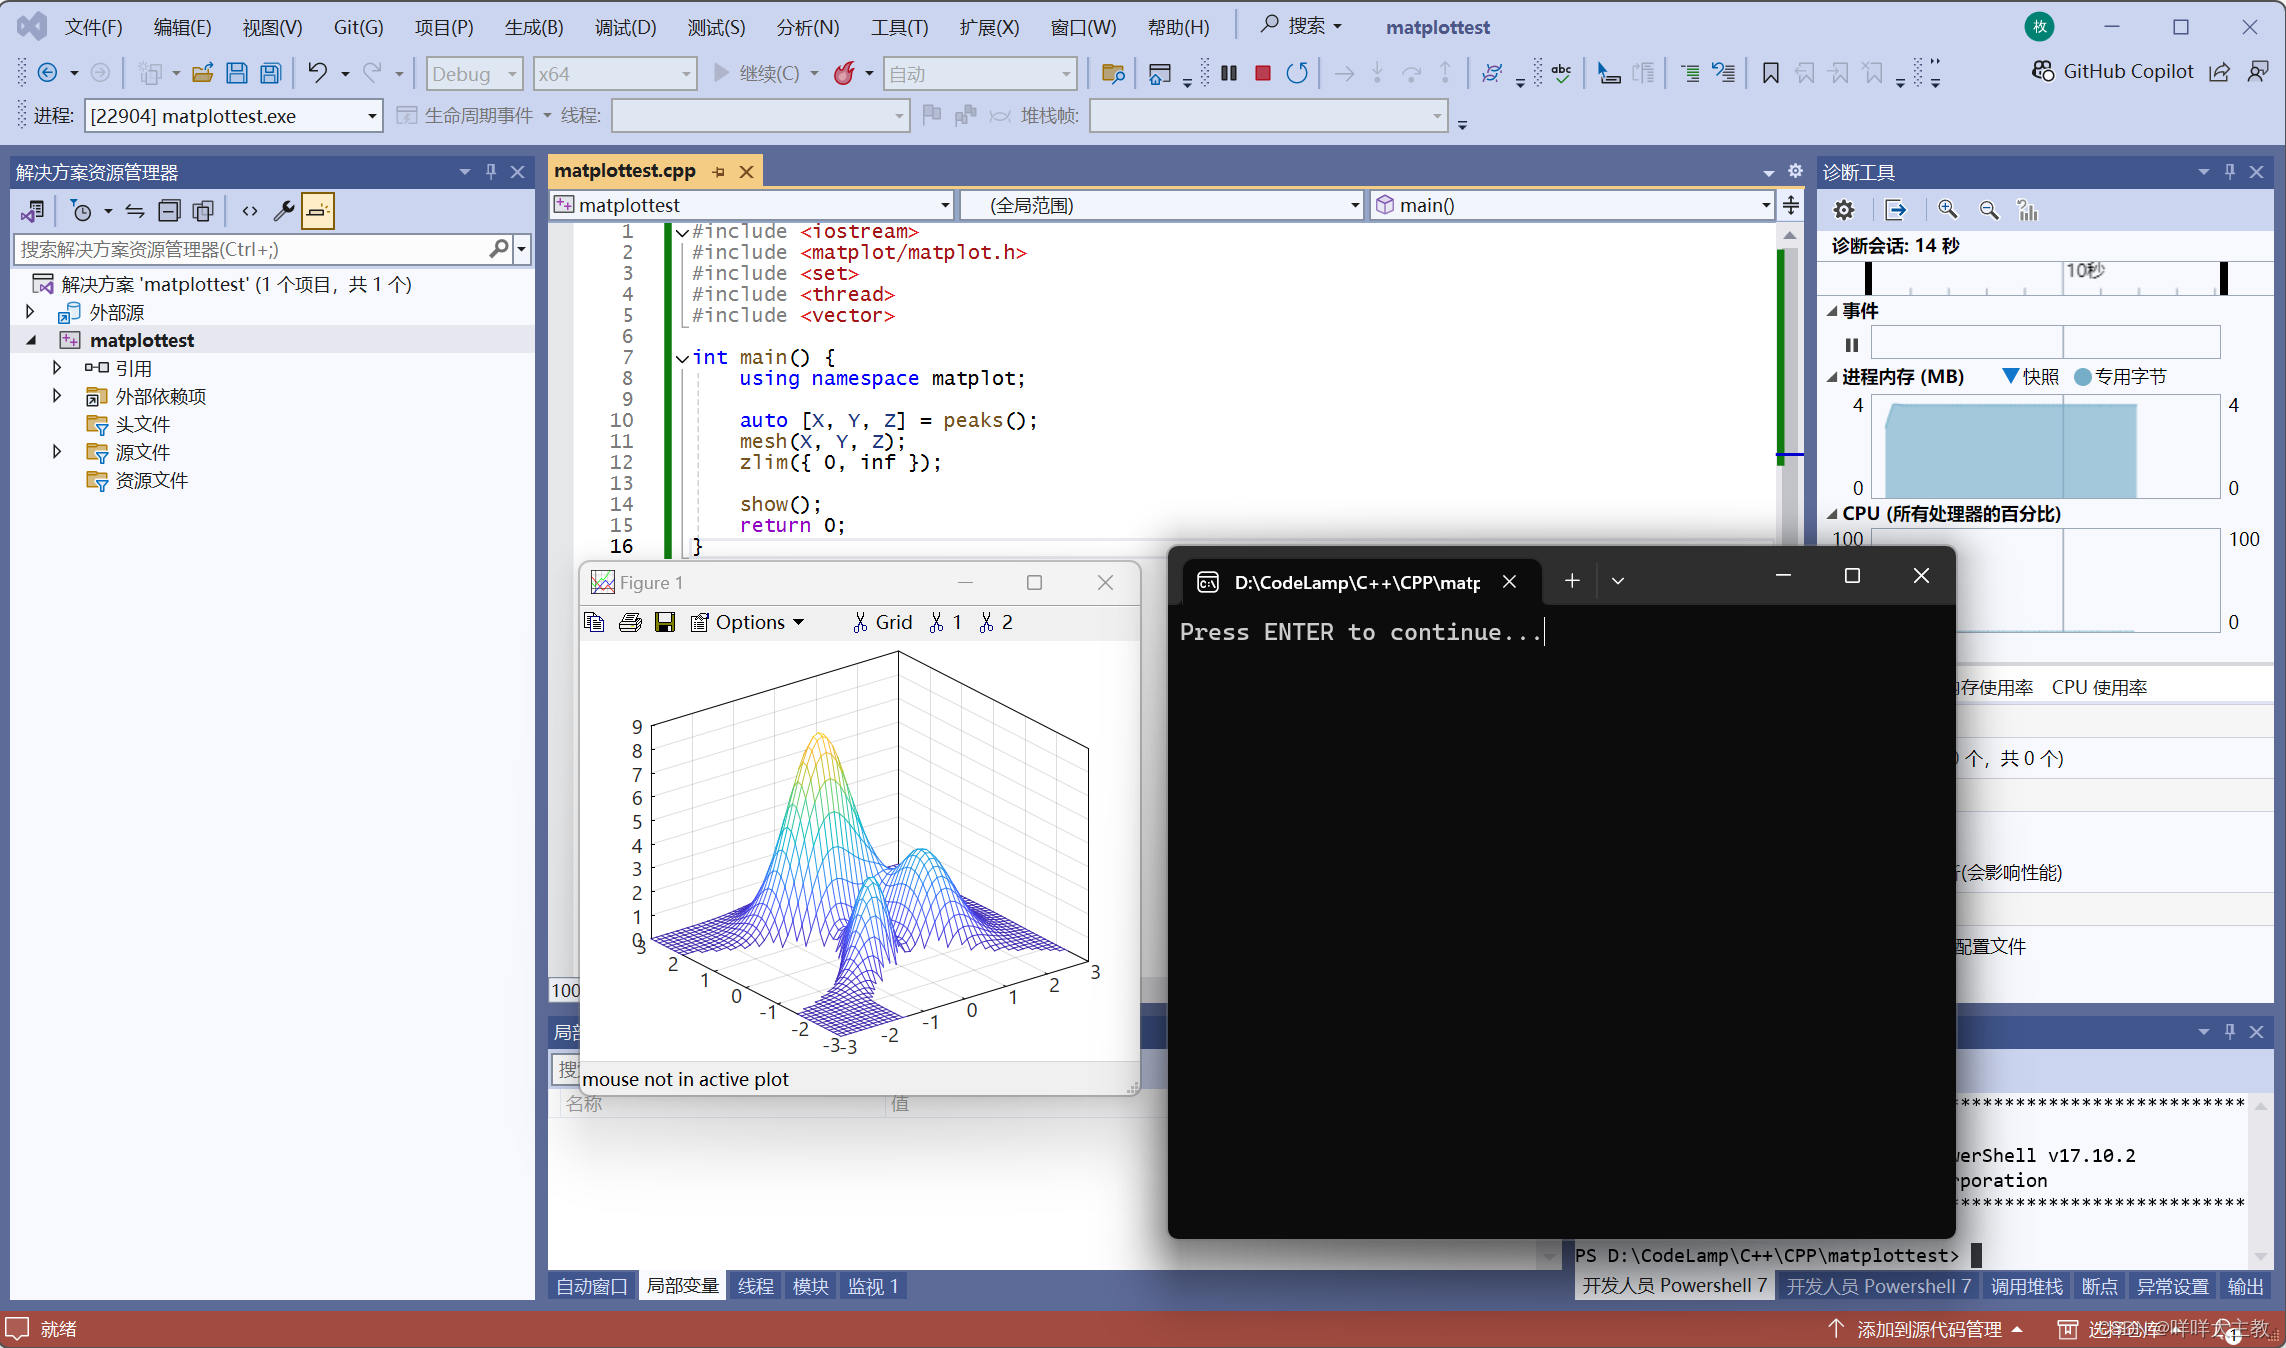
#include <iostream>
#include <matplot/matplot.h>
#include <set>
#include <thread>
#include <vector>

int main() {
    using namespace matplot;

    auto [X, Y, Z] = peaks();
    mesh(X, Y, Z);
    zlim({ 0, inf });

    show();
    return 0;
}


 611
611

 被折叠的 条评论
为什么被折叠?
被折叠的 条评论
为什么被折叠?
 到【灌水乐园】发言


