


对应示例程序:
measure_circuit_width_lines_gauss.hdev
目标:测量pcb板上的走线轨迹的宽度
思路为:
1.读取图像
2.根据图像特性,将R,G,B的三通道图像分成R,G,B的三幅单通道图像,单独处理G图像
3.利用形态学的处理方法,膨胀,开操作等,取出待检测直线区域
4.利用line_gauss算子,提取出ROI区域中的直线,并获取直线上的每个点的宽度
5.将宽度的值与容许的阈值进行比较,并显示
例程相对简单,但是利用形态学的方法定位到ROI区域,以及寻找Tuple中的小于Min和Max的方法,值得学习。
tuple_find (min2(LineWidth,MaxTrackWidth), MaxTrackWidth, IndicesTooBroad)
图像:
代码:
//前期准备 开窗口 设置字体 读取图像
dev_update_off ()
dev_close_window ()
read_image (Image, 'pcb_color')
get_image_size (Image, Width, Height)
dev_open_window_fit_image (Image, 0, 0, -1, -1, WindowHandle)
set_display_font (WindowHandle, 16, 'mono', 'true', 'false')
dev_display (Image)
dev_set_draw ('margin')
dev_set_color ('yellow')
*
*设置宽度的最大、最小阈值 可以调整
* Define the minimum and maximum width of the pcb tracks
MaxTrackWidth := 6.0
MinTrackWidth := 4.0
*
//根据先验知识,画个矩形子区域进行后续的测量
* Select a sub-region of the image
Rectangle := [271,285,528,718]
gen_rectangle1 (PcbPart, Rectangle[0], Rectangle[1], Rectangle[2], Rectangle[3])
dev_display (Image)
dev_display (PcbPart)
disp_message (WindowHandle, 'Measure the width of tracks using lines_gauss', 'window', 12, 12, 'black', 'true')
disp_continue_message (WindowHandle, 'black', 'true')
stop ()
//调整下窗口 把子区域进行显示 调整后的的窗口略大于之前画的矩形
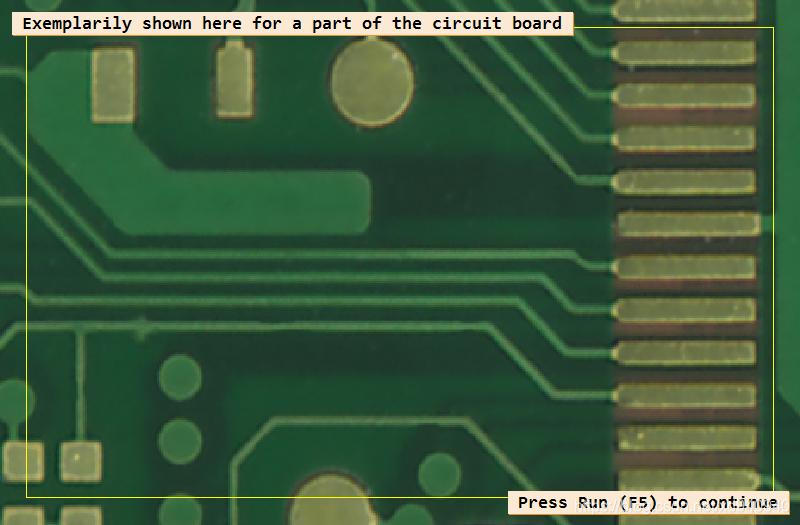
dev_set_part (Rectangle[0] - 15, Rectangle[1] - 15, Rectangle[2] + 15, Rectangle[3] + 15)
dev_display (Image)
dev_display (PcbPart)
disp_message (WindowHandle, 'Exemplarily shown here for a part of the circuit board', 'window', 12, 12, 'black', 'true')
disp_continue_message (WindowHandle, 'black', 'true')
stop ()
*
//进行检测 主要是Blob分析 形态学处理 把PCB上的轨迹线部分抠出来 这个需要学习
* Extract the tracks
//根据图像可以发现,图像的绿色较多,因此把3通道的图像分成R,G,B三个通道图 再单独对G图像进行处理
decompose3 (Image, ImageR, ImageG, ImageB) //把一个RGB三通道图像 分成R\G\B三个单通道图像
reduce_domain (ImageG, PcbPart, ImageReduced) //根据矩形 从原图中抠ROI图像
threshold (ImageReduced, Region, 90, 255) //阈值分割
dilation_circle (Region, RegionDilation, 3.5) //圆形膨胀
opening_rectangle1 (Region, RegionOpening, 8, 8) //矩形开操作
dilation_circle (RegionOpening, RegionDilation1, 3.5) //圆膨胀
difference (Region, RegionDilation1, RegionDifference) //求两个图像的差异 得到只剩下线的RegionDifference
difference (RegionDilation, RegionDilation1, RegionDifference) //求两个图像的差异部分
connection (RegionDifference, ConnectedRegions) //连通域分割
select_shape (ConnectedRegions, RegionSelected, 'area', 'and', 260, 4595) //根据面积进行区域筛选
union1 (RegionSelected, RegionTracks) //合并符合条件的区域
reduce_domain (ImageReduced, RegionTracks, ImageReducedTracks) //抠图 把PCB上的线抠出来
*
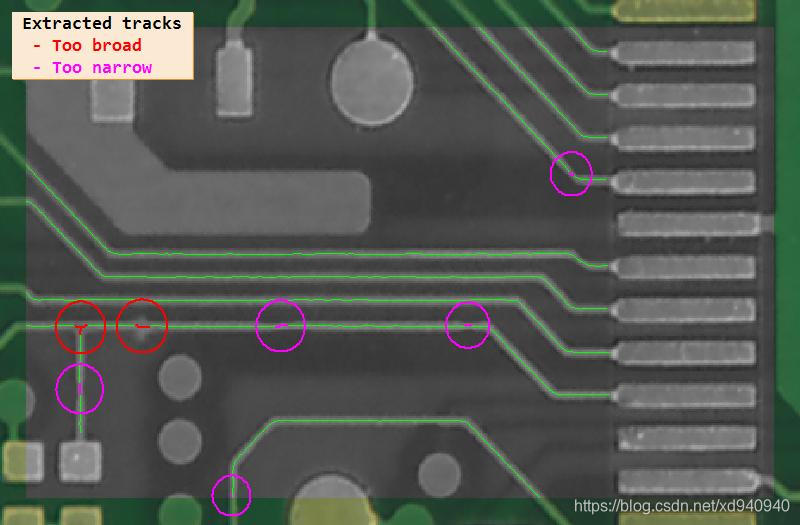
* Measure the position and the width of the tracks
lines_gauss (ImageReducedTracks, Lines, 1.5, 1, 8, 'light', 'true', 'bar-shaped', 'true') //检测图像中的线条及其宽度
select_shape_xld (Lines, SelectedXLD, 'contlength', 'and', 20, 99999) //根据 线长 筛选直线
dev_display (Image)
dev_set_color ('yellow')
dev_display (PcbPart)
dev_set_color ('green')
dev_set_line_width (2)
dev_display (Lines)
disp_message (WindowHandle, 'Extracted tracks', 'window', 12, 12, 'black', 'true')
disp_continue_message (WindowHandle, 'black', 'true')
stop ()
*
* Compute the width of the tracks
//计算提取出的直线的宽度
count_obj (SelectedXLD, NumberL)
RowLine := []
ColLine := []
LineWidth := []
for IndexL := 1 to NumberL by 1
select_obj (SelectedXLD, Line, IndexL)
get_contour_xld (Line, Row, Column) //获取每条直线上的点坐标
get_contour_attrib_xld (Line, 'width_left', WidthL) //得到线上每个点的属性 (直线区域上的上边缘到中心点的距离)
get_contour_attrib_xld (Line, 'width_right', WidthR) //直线区域上的下边缘到中线点的距离(待验证)
RowLine := [RowLine,Row] //两个Tuple进行合并 相当于把每个坐标都放在这个Tupe里面
ColLine := [ColLine,Column]
LineWidth := [LineWidth,WidthR + WidthL] //直线的宽度就是两个距离的合
endfor
*
* Detect the tracks with a wrong width
//找小于最小阈值 或者大于最大阈值的点
//先把LineWidth中的数与最大阈值进行比较,如果比最大值大,那么这个值就被替换成了MaxTrackWidth,
这时再从LineWidth中找等于MaxTrackWidth的点,那个点就是超过范围的点,记录它的ID,放到IndicesTooBroad中
没找到符合条件的点就返回-1
tuple_find (min2(LineWidth,MaxTrackWidth), MaxTrackWidth, IndicesTooBroad)
tuple_find (max2(LineWidth,MinTrackWidth), MinTrackWidth, IndicesTooNarrow)
if (IndicesTooBroad == -1)
IndicesTooBroad := [] //没找到大于阈值的点 那么太宽的这个Tuple就设置为空
endif
if (IndicesTooNarrow == -1)
IndicesTooNarrow := []
endif
//将单个像素存储为图像区域
//subset 选取数组t中的第i个元素
//根据上一步找出的太宽或者太窄点的ID,进行点 转变成 区域
gen_region_points (RegionTooBroad, subset(RowLine,IndicesTooBroad), subset(ColLine,IndicesTooBroad))
gen_region_points (RegionTooNarrow, subset(RowLine,IndicesTooNarrow), subset(ColLine,IndicesTooNarrow))
*
//显示测量结果
* 处理太宽的区域
connection (RegionTooBroad, RegionTooBroad) //将符合要求的区域进行连通域分割
gen_contours_skeleton_xld (RegionTooBroad, TracksTooBroad, 1, 'filter') //区域转化成XLD轮廓
smallest_circle (RegionTooBroad, RowTooBroad, ColumnTooBroad, RadiusTooBroad) //计算它的最小外接圆,用来定位展示
//创建与圆或圆弧相对应的XLD轮廓 其实就是把最小的外接圆 进行放大显示 便于观察
gen_circle_contour_xld (CircleTooBroad, RowTooBroad, ColumnTooBroad, min2(RadiusTooBroad + 10,20), 0, 6.28318, 'positive', 1)
*处理太窄的区域
connection (RegionTooNarrow, RegionTooNarrow) //连通域分割
gen_contours_skeleton_xld (RegionTooNarrow, TracksTooNarrow, 1, 'filter') //转化成XLD轮廓
smallest_circle (RegionTooNarrow, RowTooNarrow, ColumnTooNarrow, RadiusTooNarrow) //最小外接圆
gen_circle_contour_xld (CircleTooNarrow, RowTooNarrow, ColumnTooNarrow, min2(RadiusTooNarrow + 10,20), 0, 6.28318, 'positive', 1)
dev_clear_window ()
dev_display (Image)
dev_display (ImageReduced)
dev_set_line_width (1)
dev_set_color ('green')
dev_display (Lines)
dev_set_line_width (2)
dev_set_color ('red')
dev_display (TracksTooBroad) //显示太宽的线
dev_display (CircleTooBroad) //用最小外接圆进行标记定位
dev_set_color ('magenta')
dev_display (CircleTooNarrow) //显示太窄的线
dev_display (TracksTooNarrow) //用最小外接圆进行标记定位
disp_message (WindowHandle, ['Extracted tracks',' - Too broad',' - Too narrow'], 'window', 12, 12, ['black','red','magenta'], 'true')
用到的几个算子:
decompose3 --把一个RGB三通道图像 分成R\G\B三个单通道图像
lines_gauss–检测图像中的线条
gen_region_points – 将单个像素存储为图像区域
subset --选取数组t中的第i个元素
tuple_find–返回一个元组在另一个元组中所有出现的索引 (就是在一个Tuple中找等于另一个Tuple的值,返回它的ID)
参考资料:
[1].https://blog.csdn.net/douglax/article/details/38669941
[2].https://www.cnblogs.com/hu16683845/p/9181344.html


 被折叠的 条评论
为什么被折叠?
被折叠的 条评论
为什么被折叠?
 到【灌水乐园】发言


