


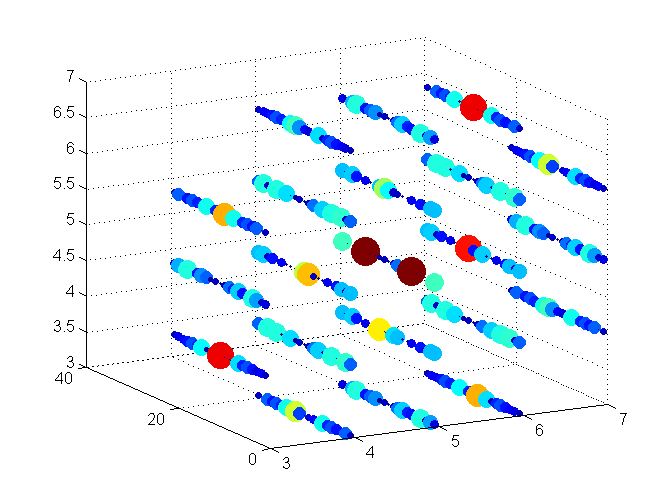
今天来画3D plot
% Load the data
load latticeExample
xx = x(:);yy = y(:);zz = z(:);
% locate the non-zero points
a = find(T~=0);
% plot the non-zero points using a scatter plot
% use the values of T to represent both color and size of symbols
scatter3(xx(a),yy(a),zz(a),1000*T(a),T(a),'filled');
% set the view
view(3);
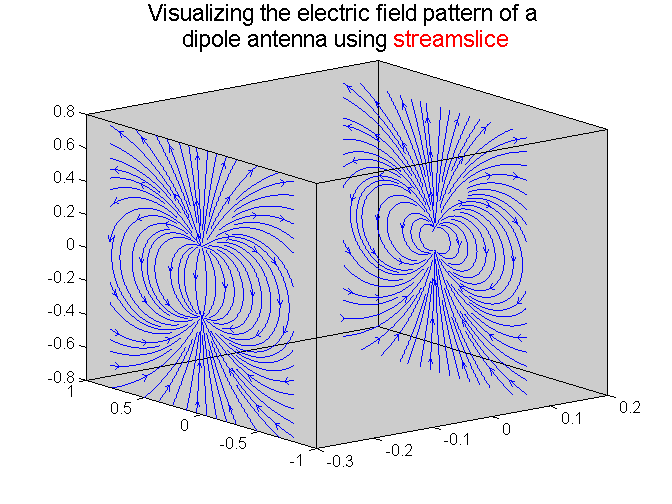
接下来STREAM SLICE;
%% Generate the data
% define the grid
x_lim=.8; y_lim=.8; z_lim=.8; step=.01;
x=[-x_lim:step:x_lim]; y=[-y_lim:step:y_lim]; z=[-z_lim:step:z_lim];
[x y z]=meshgrid(x,y,z);r=sqrt(x.^2+y.^2+z.^2);
%generate the data
cos_theta=z./r; sin_theta=sqrt(1-(cos_theta).^2); % These are the angles made by the x,y,z axes
cos_phi=x./sqrt(x.^2+y.^2); sin_phi=y./sqrt(x.^2+y.^2);
V_dip_ang=cos_theta; %only the angular dependence of the radiation pattern is considered
theta_hat_x=cos_theta.*cos_phi; theta_hat_y=cos_theta.*sin_phi; theta_hat_z=-sin_theta; % theta_hat direction resolved in x,y, and z directions
r_hat_x=sin_theta.*cos_phi; r_hat_y=sin_theta.*sin_phi; r_hat_z=cos_theta; %r_hat direction resolved in x,y, and z directions
E_ang_x=2*cos_theta.*r_hat_x + sin_theta.*theta_hat_x; %x component of the electric field (only the angular pattern)
E_ang_y=2*cos_theta.*r_hat_y + sin_theta.*theta_hat_y; %y component of the electric field
E_ang_z=2*cos_theta.*r_hat_z + sin_theta.*theta_hat_z; %z component of the electric field
E_ang=sqrt(E_ang_x.^2+E_ang_y.^2+E_ang_z.^2); % The magnitude of the electric field

%% Plotting the absolute value of the potential and the magnitude of the electric field distribution on a spehere
% plot the data
streamslice(x,y,z,E_ang_x,E_ang_y,E_ang_z,[-.3 .1],[],[]); % This is used for vector data
% set the view
campos([-3,-15,5])
box on
% set the background and tick colors
set(gca,'Color',[.8,.8,.8],'XColor','black', ...
	'YColor','black','ZColor','black')
%annotate
title({'Visualizing the electric field pattern of a ',...
      'dipole antenna using \color{red}streamslice'},'Fontsize',14)
今天时间有点紧,,就先这些吧。。


 6680
6680

 被折叠的 条评论
为什么被折叠?
被折叠的 条评论
为什么被折叠?
 到【灌水乐园】发言


