


GDB 调试工具
GDB 是一个由 GNU 开源组织发布的、Unix/Linux 操作系统下的、基于命令行的、功能强大的程序调试工具。 对于一名 Linux 下工作的 C/C++ 程序员,GDB 是必不可少的工具。
本文主要介绍 GDB 工具的基本用法,熟练掌握这些技巧将有助于提高开发效率,更快地排查问题。
启动 gdb
对 C/C++ 程序的调试,需要在编译前就加上 -g 选项:
g++ -g hello.cpp -o hello
调试可执行文件
调试可执行文件:
gdb <program>
program 也就是你的执行文件,一般在当前目录下。
调试 core 文件
调试 core 文件(core 是程序非法执行后 core dump 后产生的文件):
gdb <program> <core dump file>
gdb program core.11127
调试服务程序
调试服务程序:
gdb <program> <PID>
gdb hello 11127
如果你的程序是一个服务程序,那么你可以指定这个服务程序运行时的进程 ID。gdb 会自动 attach 上去,并调试该程序。需要注意,program 应该能在 PATH 环境变量中搜索得到。
调试带参数的程序
可以在 gdb 启动时,通过选项指定被调试程序的参数,例如:
gdb -args <program> a b c
也可以在 gdb 中,通过命令来设置,例如:
(gdb) set args a b c
(gdb) show args
Argument list to give program being debugged when it is started is "a b c".
也可以在运行程序时,直接指定:
(gdb) r a b
Starting program: /tmp/a.out a b
(gdb) show args
Argument list to give program being debugged when it is started is "a b".
(gdb) r
Starting program: /tmp/a.out a b
可以看出,参数已经被保存了,下次运行时直接运行 run 命令,即可。
最后,如果想让参数设为空,不带参数设置即可,如下。
(gdb) set args
gdb 交互命令
启动 gdb 后,进入到交互模式,通过以下命令完成对程序的调试。
提示:
- 高频使用的命令一般都会有缩写,熟练使用这些缩写命令能提高调试的效率。
- 交互模式下直接回车的作用是重复上一指令,对于单步调试非常方便。
运行
| 命令 | 简写 | 说明 |
|---|---|---|
run | r | 其作用是运行程序,当遇到断点后,程序会在断点处停止运行, 等待用户输入下一步的命令。 |
continue | c | 继续执行,到下一个断点处(或运行结束)。 |
next | n | 单步跟踪程序,当遇到函数调用时,也不进入此函数体。 |
step | s | 单步调试如果有函数调用,则进入函数。 |
until | 当你厌倦了在一个循环体内单步跟踪时,这个命令可以运行程序 直到退出循环体。 | |
until 行号 | 运行至某行,不仅仅用来跳出循环。 | |
finish | 运行程序,直到当前函数完成返回,并打印函数返回时的堆栈地址 和返回值及参数值等信息。 | |
call 函数(参数) | 调用程序中可见的函数,并传递“参数”,如:call gdb_test(55) | |
quit | q | 退出 gdb |
提示:next 命令与 step 的主要区别是,step 遇到用户自定义的函数,将步进到函数中去运行,而 next 则直接调用函数,不会进入到函数体内。
设置断点
| 命令 | 简写 | 说明 |
|---|---|---|
break n | b n | 在第 n 行处设置断点(break 缩写为 b) |
b fn1 if a > b | 条件断点设置 | |
break func | b func | 在函数 func() 的入口处设置断点,如:break cb_button |
delete 断点号n | d n | 删除第 n 个断点 |
disable 断点号n | 暂停第 n 个断点 | |
enable 断点号n | 开启第 n 个断点 | |
clear 行号n | 清除第 n 行的断点 | |
info breakpoints | info b | 显示当前程序的断点设置情况 |
delete breakpoints | 清除所有断点 |
查看源代码
| 命令 | 简写 | 说明 |
|---|---|---|
list | l | 其作用就是列出程序的源代码,默认每次显示10行。 |
list 行号 | 将显示当前文件以“行号”为中心的前后10行代码,如:list 12 | |
list 函数名 | 将显示“函数名”所在函数的源代码,如:list main | |
list | 不带参数,将接着上一次 list 命令的,输出下边的内容。 |
打印表达式
print 表达式(简记为 p),其中“表达式”可以是任何当前正在被测试程序的有效表达式,比如当前正在调试C语言的程序,那么“表达式”可以是任何 C 语言的有效表达式,包括数字,变量甚至是函数调用。
| 命令 | 说明 |
|---|---|
print a | 将显示整数 a 的值 |
print ++a | 将把 a 中的值加 1,并显示出来 |
print name | 将显示字符串 name 的值 |
print gdb_test(22) | 将以整数 22 作为参数调用 gdb_test() 函数 |
print gdb_test(a) | 将以变量 a 作为参数调用 gdb_test() 函数 |
display 表达式 | 在单步运行时将非常有用,使用display命令设置一个表达式后, 它将在每次单步进行指令后,紧接着输出被设置的表达式及值。 如:display a |
watch 表达式 | 设置一个监视点,一旦被监视的“表达式”的值改变,gdb 将强行 终止正在被调试的程序。如:watch a |
whatis | 查询变量或函数 |
info function | 查询函数 |
info locals | 显示当前堆栈页的所有变量 |
查询运行信息
| 命令 | 说明 |
|---|---|
where/bt | 当前运行的堆栈列表 |
bt backtrace | 显示当前调用堆栈 |
up/down | 改变堆栈显示的深度 |
set args 参数 | 指定运行时的参数 |
show args | 查看设置好的参数 |
info program | 来查看程序的是否在运行,进程号,被暂停的原因。 |
分割窗口
| 命令 | 说明 |
|---|---|
layout | 用于分割窗口,可以一边查看代码,一边测试 |
layout src | 显示源代码窗口 |
layout asm | 显示反汇编窗口 |
layout regs | 显示源代码/反汇编和 CPU 寄存器窗口 |
layout split | 显示源代码和反汇编窗口 |
Ctrl + L | 刷新窗口 |
更强大的工具
CGDB
cgdb 可以看作 gdb 的界面增强版,用来替代 gdb 的 gdb -tui。cgdb 主要功能是在调试时进行代码的同步显示,这无疑增加了调试的方便性,提高了调试效率。界面类似 vi,符合 unix/linux 下开发人员习惯;如果熟悉 gdb 和 vi,几乎可以立即使用 cgdb。
关于 CGDB 的使用,可以阅读下面资料。
GDB 可视化工具 gdbgui
gdbgui 是一款基于浏览器的 gdb 可视化工具,后台使用 Python 语言编写。gdbgui 可作为 GDB 调试器的前端,可用于 C/C++、Go、Rust 等项目,提供打断点、单步调试、查看堆栈等功能。
安装 gdbgui
官方提供了多种安装 gdbgui 的方式,下面将逐一介绍。在开始之前,你需要先执行下面命令安装依赖。
Ubuntu/Debian 系统
sudo apt-get install gdb python3
macOS 系统
brew install python3
brew install gdb --with-python --with-all-targets
使用 pipx 安装
python3 -m pip install --user pipx
python3 -m userpath append ~/.local/bin
pipx install gdbgui
$ pipx install gdbgui
  installed package gdbgui 0.15.1.0, installed using Python 3.8.10
  These apps are now globally available
    - gdbgui
done! ✨ 🌟 ✨
使用 pip 安装
pip install gdbgui
pip install --upgrade gdbgui
直接下载安装
Download and run the binary executable for your system from GitHub Releases.
使用示例
相关链接
- 项目官网:https://gdbgui.com
- Github 仓库:GitHub - cs01/gdbgui: Browser-based frontend to gdb (gnu debugger). Add breakpoints, view the stack, visualize data structures, and more in C, C++, Go, Rust, and Fortran. Run gdbgui from the terminal and a new tab will open in your browser.
源码里面有个example目录,下面有很多例子。
Valgrind 内存泄漏检测工具
Valgrind 是 Linux 系统中一款内存泄漏(Memory Leak)检测工具,本文主要介绍 Valgrind 的工作原理及其基本用法。
Valgrind 简介
Valgrind 是一套 Linux 下的开源仿真调试工具集,遵循 GPLv2 许可协议,可用于内存调试、内存泄漏检测以及性能分析。
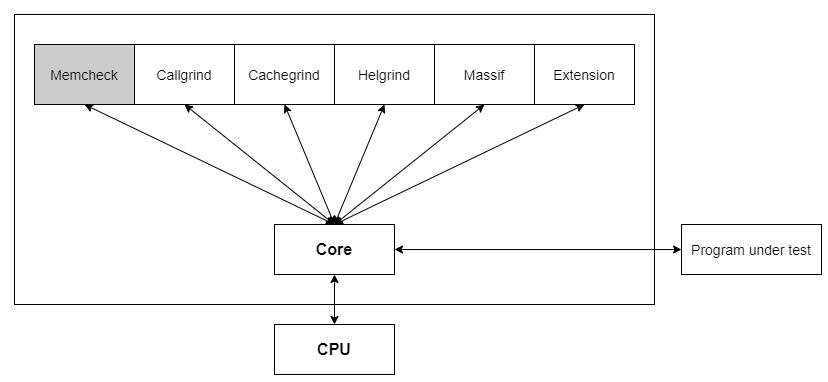
Valgrind 由内核(core)以及基于内核的其他调试工具组成,内核类似于一个框架(framework),它模拟了一个 CPU 环境,并提供服务给其他工具;而其他工具则类似于插件 (plug-in),利用内核提供的服务完成各种特定的内存调试任务。

Valgrind 工具
Valgrind 包含下列一些工具:
Memcheck:内存错误检测器(memory error detector),这是最常用的工具,用于检测程序中的内存问题,如泄漏、越界、非法指针等。memcheck 会检测所有对内存的读写操作,一切对 malloc()、free()、new 和 delete 的调用都会被捕获,所以能检测以下问题:
- 对未初始化内存的使用;
- 读/写释放后的内存块;
- 读/写超出 malloc 分配的内存块;
- 读/写不适当的栈中内存块;
- 内存泄漏,指向一块内存的指针永远丢失;
- 不正确的 malloc/free 或 new/delete 匹配;
- memcpy() 相关函数中的 dst 和 src 指针重叠。
Cachegrind:缓存和分支预测探查器(cache and branch-prediction profiler),分析 CPU 的 cache 命中率、丢失率,用于进行代码优化。它模拟 CPU 中的一级缓存 I1,Dl 和二级缓存,能够精确地指出程序中 cache 的丢失和命中。如果需要,它还能够为我们提供 cache 丢失次数,内存引用次数,以及每行代码,每个函数,每个模块,整个程序产生的指令数,这对优化程序有很大的帮助。
Callgrind:生成调用图的缓存和分支预测探查器(call-graph generating cache and branch-prediction profiler),是 cachegrind 的扩展,用于检测程序代码的运行时间和调用过程,以及分析程序性能。callgrind 收集程序运行时的一些数据,建立函数调用关系图,还可以有选择地进行 cache 模拟。在运行结束时,它会把分析数据写入 一个文件。callgrind_annotate 可以把这个文件的内容转化成可读的形式。
Massif:堆栈探查器/分析器(heap profilers),它能测量程序在堆栈中使用了多少内存,告诉我们堆块,堆管理块和栈的大小。Massif 能帮助我们减少内存的使用,在带有虚拟内存的现代系统中,它还能够加速我们程序的运行,减少程序停留在交换区中的几率。
Helgrind:线程错误检测器(thread error detectors),用于检查多线程程序的竞态条件。helgrind 寻找内存中被多个线程访问,而又没有一贯加锁的区域,这些区域往往是线程之间失去同步的地方,而且会导致难以发掘的错误。helgrind 实现了名为“Eraser”的竞争检测算法,并做了进一步改进,减少了报告错误的次数。
此外,Valgrind 还有提供了 Lackey 和 Nulgrind 工具。Lackey 是小型工具,很少用到;Nulgrind 只是为开发者展示如何创建一个工具。这里不作介绍。
Valgrind 的体系结构如下图所示:
更多内容可查阅 https://valgrind.org/info/tools.html
Valgrind 安装
Debian 和 Ubuntu 可使用 apt 安装
sudo apt install valgrind
CentOS 和 Fedora 可使用 yum 或 dnf 安装
sudo yum install valgrind
sudo dnf install valgrind
Arch Linux 可使用 pacman 安装
sudo pacman -S valgrind
亦可使用源码编译安装(可以在 valgrind 官网 下载源码压缩包,比如 valgrind-3.17.0)
wget https://sourceware.org/pub/valgrind/valgrind-3.17.0.tar.bz2
tar -xf valgrind-3.17.0.tar.bz2
cd valgrind-3.17.0
./configure
make
make install
检查是否安装成功
valgrind --version
使用示例
内存泄漏
在源文件 memoryLeak.c 中申请一块内存空间,但不释放,如下:
memoryLeak.c
#include <stdlib.h>

int main(void)
{
    // create an array of ARR_SIZE ints
    int *intArray = malloc(sizeof(int) * 1000);

    // end without freeing!
    return 0;
}
编译,生成 memoryLeak
gcc memoryLeak.c -o memoryLeak
使用 valgrind 对程序进行检测
valgrind ./memoryLeak
分析结果如下:
==8079== Memcheck, a memory error detector
==8079== Copyright (C) 2002-2017, and GNU GPL'd, by Julian Seward et al.
==8079== Using Valgrind-3.15.0 and LibVEX; rerun with -h for copyright info
==8079== Command: ./memoryLeak
==8079==
==8079==
==8079== HEAP SUMMARY:
==8079==     in use at exit: 4,000 bytes in 1 blocks
==8079==   total heap usage: 1 allocs, 0 frees, 4,000 bytes allocated
==8079==
==8079== LEAK SUMMARY:
==8079==    definitely lost: 4,000 bytes in 1 blocks
==8079==    indirectly lost: 0 bytes in 0 blocks
==8079==      possibly lost: 0 bytes in 0 blocks
==8079==    still reachable: 0 bytes in 0 blocks
==8079==         suppressed: 0 bytes in 0 blocks
==8079== Rerun with --leak-check=full to see details of leaked memory
==8079==
==8079== For lists of detected and suppressed errors, rerun with: -s
==8079== ERROR SUMMARY: 0 errors from 0 contexts (suppressed: 0 from 0)
可以看到第 9 行显示,申请了 1 个 4000 字节的内存空间,但是没有释放。
添加 --leak-check=full 参数,可以看到内存泄漏的更多细节。
valgrind --leak-check=full ./memoryLeak
输出结果:
==8183== Memcheck, a memory error detector
==8183== Copyright (C) 2002-2017, and GNU GPL'd, by Julian Seward et al.
==8183== Using Valgrind-3.15.0 and LibVEX; rerun with -h for copyright info
==8183== Command: ./memoryLeak
==8183==
==8183==
==8183== HEAP SUMMARY:
==8183==     in use at exit: 4,000 bytes in 1 blocks
==8183==   total heap usage: 1 allocs, 0 frees, 4,000 bytes allocated
==8183==
==8183== 4,000 bytes in 1 blocks are definitely lost in loss record 1 of 1
==8183==    at 0x483B7F3: malloc (in /usr/lib/x86_64-linux-gnu/valgrind/vgpreload_memcheck-amd64-linux.so)
==8183==    by 0x109167: main (memoryLeak.c:6)
==8183==
==8183== LEAK SUMMARY:
==8183==    definitely lost: 4,000 bytes in 1 blocks
==8183==    indirectly lost: 0 bytes in 0 blocks
==8183==      possibly lost: 0 bytes in 0 blocks
==8183==    still reachable: 0 bytes in 0 blocks
==8183==         suppressed: 0 bytes in 0 blocks
==8183==
==8183== For lists of detected and suppressed errors, rerun with: -s
==8183== ERROR SUMMARY: 1 errors from 1 contexts (suppressed: 0 from 0)
可以看到第 13 行显示,内存泄漏发生在 memoryLeak.c 的第 6 行代码。
接着,我们增加一行代码修复内存泄漏。
memoryLeak.c
#include <stdlib.h>

int main(void)
{
    // create an array of ARR_SIZE ints
    int *intArray = malloc(sizeof(int) * 1000);

    // end without freeing!
    free(intArray);
    return 0;
}
重新编译并检测
gcc memoryLeak.c -o memoryLeak
valgrind ./memoryLeak
输出结果如下:
==8426== Memcheck, a memory error detector
==8426== Copyright (C) 2002-2017, and GNU GPL'd, by Julian Seward et al.
==8426== Using Valgrind-3.15.0 and LibVEX; rerun with -h for copyright info
==8426== Command: ./memoryLeak
==8426==
==8426==
==8426== HEAP SUMMARY:
==8426==     in use at exit: 0 bytes in 0 blocks
==8426==   total heap usage: 1 allocs, 1 frees, 4,000 bytes allocated
==8426==
==8426== All heap blocks were freed -- no leaks are possible
==8426==
==8426== For lists of detected and suppressed errors, rerun with: -s
==8426== ERROR SUMMARY: 0 errors from 0 contexts (suppressed: 0 from 0)
可以看到,内存泄漏已经消除。


 被折叠的 条评论
为什么被折叠?
被折叠的 条评论
为什么被折叠?
 到【灌水乐园】发言


