


 本文介绍了如何使用Vue.js和ECharts库创建柱状图,并实现当数据为正负值时,柱子颜色不同。代码展示了如何初始化图表、设置选项以及处理点击和窗口大小调整事件。
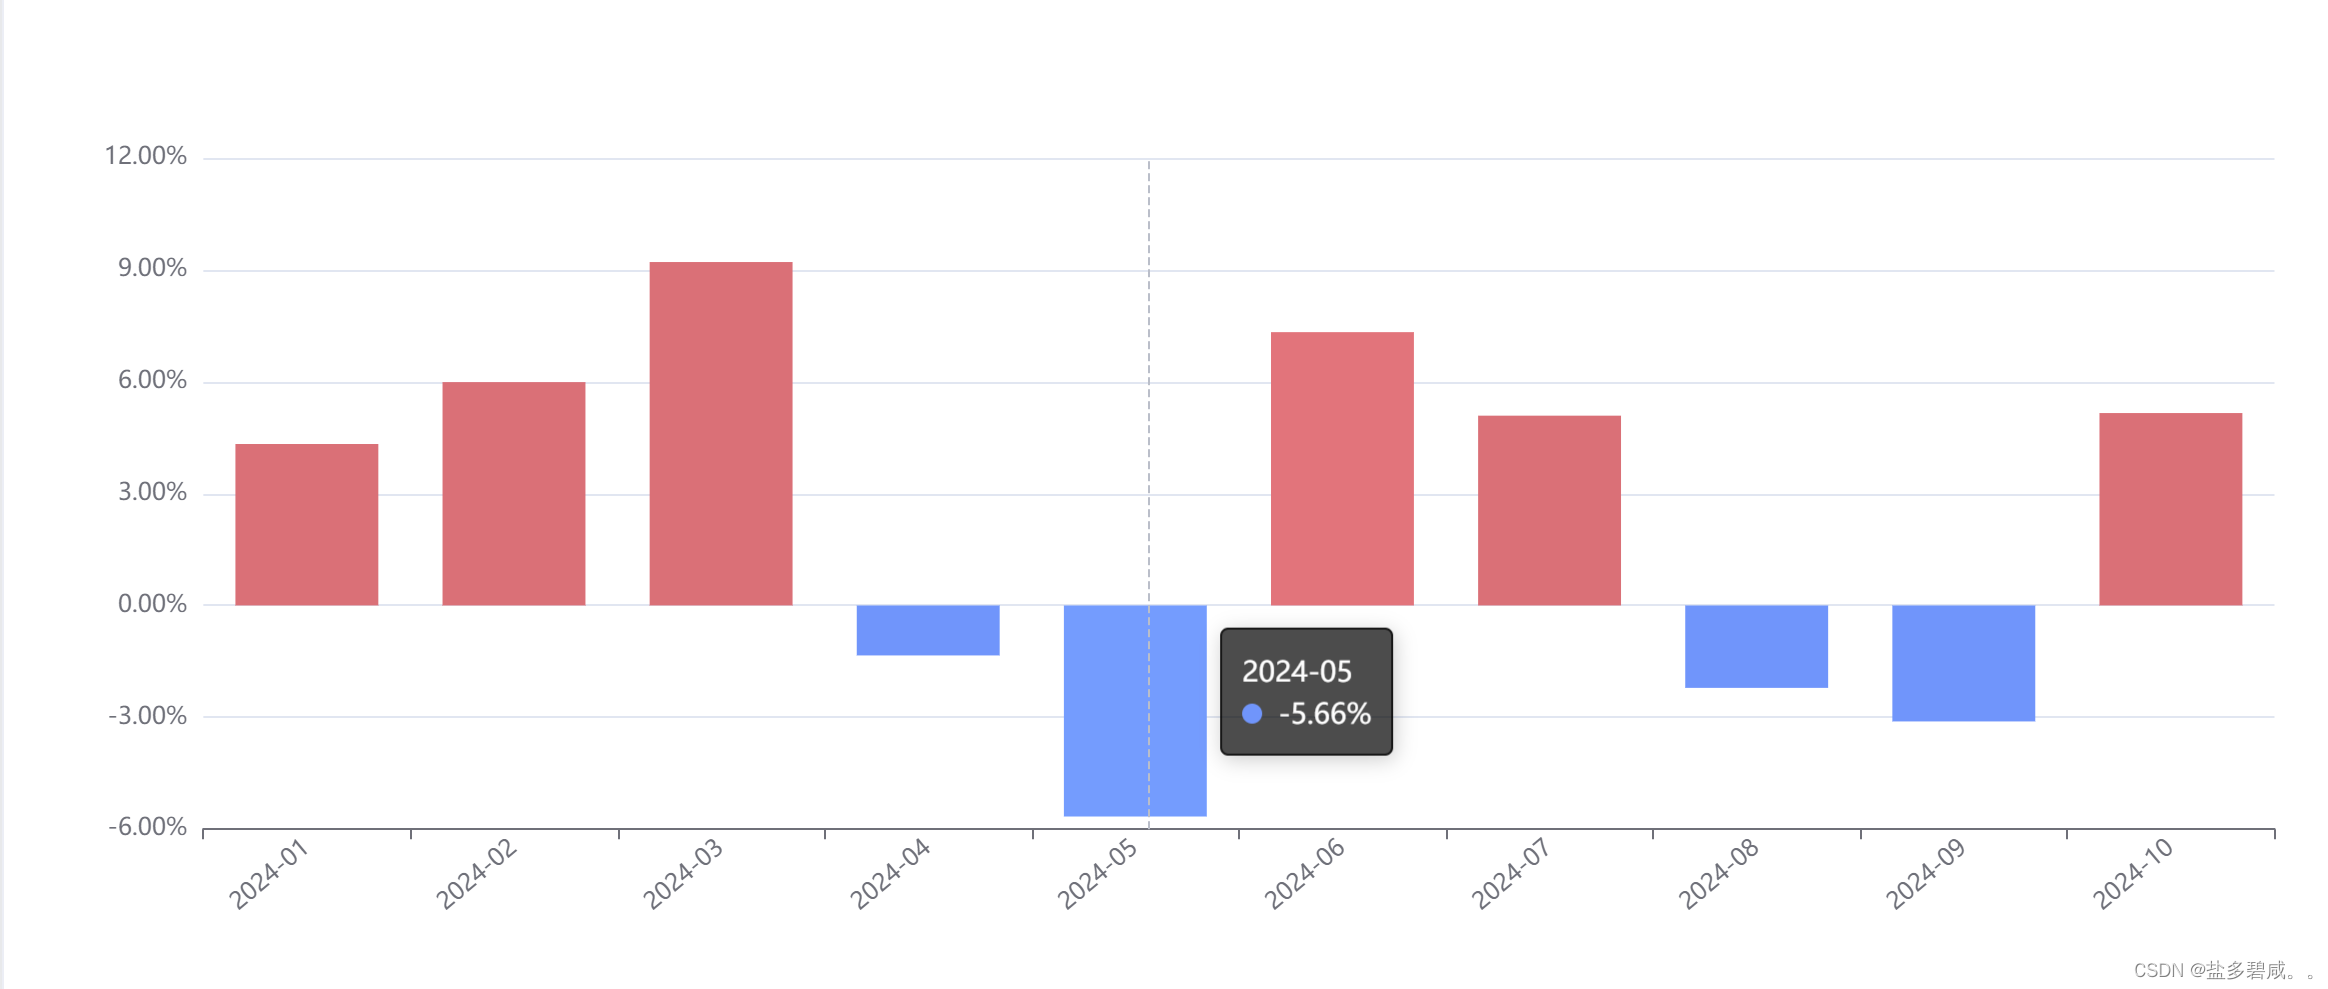
vue echarts 柱状图 正负值设置不同的颜色(效果图在文章末尾)
<template>
<div>
<!-- 柱状图 -->
<div
id="indLowConfBarChart"
ref="indLowConfBarChartRef"
style="width: 100%; height: 460px"></div>
</div>
</template>
<script>
import * as echarts from 'echarts';
export default {
name: '',
props: {},
components: {},
data () {
return {
chart: null,
_thisForChart: null,
_thisForWindow: null,
}
},
created() {},
mounted() {
this.$nextTick(() => {
this.initBarChart()
this.addEventListenerToSidebarContainer(this)
this.addEventListenerToWindowResize(this)
})
},
beforeDestroy () {
this.removeEventListenerToSidebarContainer()
this.removeEventListenerToWindowResize()
},
computed: {},
watch: {},
methods: {
initBarChart () {
let xAxisData = ['2024-01','2024-02','2024-03','2024-04','2024-05','2024-06','2024-07','2024-08','2024-09','2024-10',]
let seriesData = ['4.33','5.99','9.21','-1.34','-5.66','7.33','5.09','-2.21','-3.11','5.16']
var chartDom = document.getElementById('indLowConfBarChart');
this.chart = echarts.init(chartDom);
let that = this
let option = {
color: ['#6394F9','#F8BF20'],
legend: {
show:false,
},
grid: {
left: '7%',
right: '2%',
bottom: '14%',
},
tooltip: {
trigger: 'axis',
backgroundColor: 'rgba( 0, 0, 0,0.7)',
borderColor: 'rgba( 0, 0, 0,0.7)',
formatter:function(params) {
var str = params[0].name + '</br>'
for(let item of params) {
str = `<span style='color: #fff;'>${str}</span><div style='display:flex;align-items:center;justify-content:space-between;'><span>${item.marker}<span style='color: #fff;'>${item.seriesName}</span></span> <span style='color: #fff;'>${item.value}%</span></div>`
}
return str;
}
},
xAxis: {
data:xAxisData,
name: '',
axisLabel: {
rotate: 40,
},
axisLine: { onZero: false },
splitLine: { show: false },
splitArea: { show: false }
},
yAxis: {
splitLine: {
lineStyle: {
type: 'solid',
}
},
axisLabel: {
show: true,
formatter: (value) => {
return `${value.toFixed(2)}%`
}
},
},
series: [
{
name: '',
type:'bar',
data: seriesData,
// 正负值设置不同的颜色
itemStyle: {
normal: {
color:(val) => {
var index_color = val.value
return index_color > 0 ? '#e36f78' : '#6394F9'
}
}
}
}
]
}
this.chart.setOption(option,true);
// 重点代码 避免点击事件重复执行
this.chart.off('click')
// 散点图点击事件
this.chart.on('click', function (params) {
})
},
// 监听侧边栏导航的宽度发生变化
addEventListenerToSidebarContainer(_this) {
let sidebarContainer = document.getElementsByClassName("sidebar-container")[0];
this._thisForChart = _this;
sidebarContainer &&
sidebarContainer.addEventListener("transitionend", this.sidebarResizeHandler);
},
removeEventListenerToSidebarContainer() {
let sidebarContainer = document.getElementsByClassName("sidebar-container")[0];
this._thisForChart = null
sidebarContainer &&
sidebarContainer.removeEventListener("transitionend", this.sidebarResizeHandler);
},
sidebarResizeHandler(e) {
if (e.propertyName === "width") {
this._thisForChart.chart.resize();
}
},
// window 的尺寸发生变化的时候 会执行图表的resize
addEventListenerToWindowResize(_this) {
this._thisForWindow = _this;
window.addEventListener("resize", this.windowResizeHandler);
},
removeEventListenerToWindowResize(_this) {
this. _thisForWindow = null
window.removeEventListener("resize", this.windowResizeHandler);
},
windowResizeHandler(e) {
this._thisForWindow.chart.resize();
},
},
}
</script>
<style lang="scss" scoped>
</style>
展示效果图:


 480
480

 被折叠的 条评论
为什么被折叠?
被折叠的 条评论
为什么被折叠?
 到【灌水乐园】发言


