


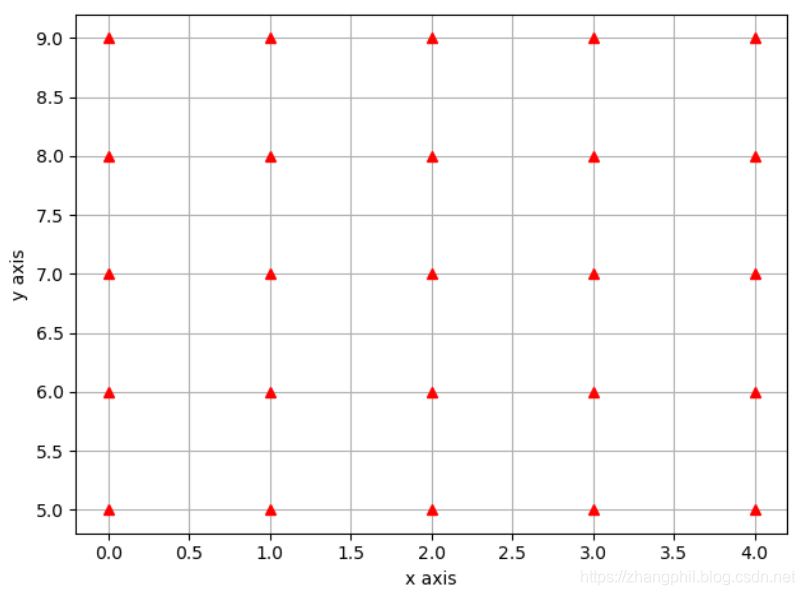
 本文通过使用Python的Matplotlib库和NumPy库,演示了如何创建二维平面数据的可视化图表。代码示例展示了如何生成线性空间数组,并使用meshgrid函数创建网格,然后在图表中以红色三角形标记表示这些数据点。
import matplotlib.pyplot as plt
import numpy as np

if __name__ == '__main__':
    a = np.linspace(start=0, stop=4, num=5, dtype=np.int32)
    b = np.linspace(start=5, stop=9, num=5, dtype=np.int32)
    print(a)
    print(b)
    x, y = np.meshgrid(a, b)
    print(x)
    print(y)
    plt.xlabel('x axis')
    plt.ylabel('y axis')
    plt.plot(x, y, marker='^', color='red', linestyle='none')
    plt.grid()
    plt.show()

    xy = [i for i in zip(x.flat, y.flat)]
    print(xy)
输出:
[0 1 2 3 4]
[5 6 7 8 9]
[[0 1 2 3 4]
 [0 1 2 3 4]
 [0 1 2 3 4]
 [0 1 2 3 4]
 [0 1 2 3 4]]
[[5 5 5 5 5]
 [6 6 6 6 6]
 [7 7 7 7 7]
 [8 8 8 8 8]
 [9 9 9 9 9]]
[(0, 5), (1, 5), (2, 5), (3, 5), (4, 5), (0, 6), (1, 6), (2, 6), (3, 6), (4, 6), (0, 7), (1, 7), (2, 7), (3, 7), (4, 7), (0, 8), (1, 8), (2, 8), (3, 8), (4, 8), (0, 9), (1, 9), (2, 9), (3, 9), (4, 9)]
二维平面的数据可视化后如图:


 3万+
3万+

 被折叠的 条评论
为什么被折叠?
被折叠的 条评论
为什么被折叠?
 到【灌水乐园】发言


