


 本文展示了如何在Python中使用Pandas库创建和操作复合索引,包括设置索引、取值以及交换索引层次。接着,通过例子解释了如何利用DataFrame的swaplevel方法调整索引层级。此外,还介绍了如何利用matplotlib进行数据可视化,包括绘制国家和城市的店铺数量条形图。文章最后部分涉及到对书籍数据的统计分析,如不同年份书籍的数量和平均评分情况。
1:设置复合索引
#coding=utf-8
import pandas as pd
a = pd.DataFrame({'a': range(7),'b': range(7, 0, -1),'c': ['one','one','one','two','two','two', 'two'],
'd': list("hjklmno")})
#print(a)
b=a.set_index(['c','d'])
print(b)
2:取值
#coding=utf-8
import pandas as pd
a = pd.DataFrame({'a': range(7),'b': range(7, 0, -1),'c': ['one','one','one','two','two','two', 'two'],
'd': list("hjklmno")})
#print(a)
b=a.set_index(['c','d'])
#print(b)
c=b['a']
# print(c)
# print(type(c))
print(c['one']['j'])
3:交换列表(交换索引)d.swaplevel()
a = pd.DataFrame({'a': range(7),'b': range(7, 0, -1),'c': ['one','one','one','two','two','two', 'two'],
'd': list("hjklmno")})
#print(a)
# b=a.set_index(['c','d'])
# print(b)
#c=b['a']
# print(c)
# print(type(c))
#print(c['one']['j'])
e=a.set_index(['d','c'])['a']
print(e.swaplevel())
4:#DateFrame不同于Series,要采用loc来取索引。
e=a.set_index(['d','c'])
f=e.swaplevel()
#print(f)
g=f.loc['one'].loc['h']
print(g)
#DateFrame不同于Series,要采用loc来取索引。
5:使用matplotlib将店铺总数排名前十的国家列出来。
#先算出数据
#coding=utf-8
import pandas as pd
file_path='./starbucks_store_worldwide.csv'
df=pd.read_csv(file_path)
#准备数据
##先按照国家进行分组
#print(df.columns)
date1=df.groupby(by='Country').count().sort_values(by='Store Number',ascending=False)[:10]

print(date1)
#画图
#coding=utf-8
import pandas as pd
from matplotlib import pyplot as plt
file_path='./starbucks_store_worldwide.csv'
df=pd.read_csv(file_path)
#准备数据
##先按照国家进行分组
#print(df.columns)
date1=df.groupby(by='Country').count()['Brand'].sort_values(ascending=False)[:10]

_x=date1.index
_y=date1.values
#print(_y)
#画图
plt.figure(figsize=(20,8),dpi=80)
plt.bar(range(len(_x)),_y)
plt.xticks(range(len(_x)),_x)
plt.show()
6:使用matplotlib呈现中国每个城市店铺的数量
#coding=utf-8
import pandas as pd
from matplotlib import pyplot as plt
file_path='./starbucks_store_worldwide.csv'
df=pd.read_csv(file_path)
#先取到国家为中国
df2=df[df['Country']=='CN']
#准备数据
##先按照国家进行分组
#print(df.columns)
date1=df2.groupby(by='City').count()['Brand'].sort_values(ascending=False)[:10]
print(date1)
#画图。(注意中文字体的处理)
#coding=utf-8
import pandas as pd
from matplotlib import pyplot as plt
from matplotlib import font_manager
my_font=font_manager.FontProperties(fname='C:\Windows\Fonts\msyh.ttc')
file_path='./starbucks_store_worldwide.csv'
df=pd.read_csv(file_path)
#先取到国家为中国
df2=df[df['Country']=='CN']
#准备数据
##先按照国家进行分组
#print(df.columns)
date1=df2.groupby(by='City').count()['Brand'].sort_values(ascending=False)[:25]
print(date1)

_x=date1.index
_y=date1.values
#print(_y)
#画图
plt.figure(figsize=(20,8),dpi=80)
plt.bar(range(len(_x)),_y,width=0.3,color='red')
plt.xticks(range(len(_x)),_x,fontproperties=my_font)
plt.show()
#画图(用barh展示)
#coding=utf-8
import pandas as pd
from matplotlib import pyplot as plt
from matplotlib import font_manager
my_font=font_manager.FontProperties(fname='C:\Windows\Fonts\msyh.ttc')
file_path='./starbucks_store_worldwide.csv'
df=pd.read_csv(file_path)
#先取到国家为中国
df2=df[df['Country']=='CN']
#准备数据
##先按照国家进行分组
#print(df.columns)
date1=df2.groupby(by='City').count()['Brand'].sort_values(ascending=False)[:25]
print(date1)

_x=date1.index
_y=date1.values
#print(_y)
#画图
plt.figure(figsize=(20,8),dpi=80)
plt.barh(range(len(_x)),_y,height=0.3,color='red')
plt.yticks(range(len(_x)),_x,fontproperties=my_font)
plt.show()
7:现在有全球排名前10000本的书
统计:a;不同年份书的数量
#1
#删除一列中有缺失的数据
date2=df[pd.notnull(df['original_publication_year'])]
print(date2)
#2
#coding=utf-8
import pandas as pd
from matplotlib import pyplot as plt
file_path='./books.csv'
df=pd.read_csv(file_path)
#print(df.info())
#df2=df.groupby(by='original_publication_year').count()['book_id'].sort_values(ascending=False)
#print(df2)
#删除一列中有缺失的数据
date2=df[pd.notnull(df['original_publication_year'])]
df2=df.groupby(by='original_publication_year').count()['book_id'].sort_values(ascending=False)
print(df2)
#3:b:不同年份书的平均评分情况
#coding=utf-8
import pandas as pd
from matplotlib import pyplot as plt
file_path='./books.csv'
df=pd.read_csv(file_path)
#print(df.info())
#df2=df.groupby(by='original_publication_year').count()['book_id'].sort_values(ascending=False)
#print(df2)
#删除一列中有缺失的数据
date2=df[pd.notnull(df['original_publication_year'])]
date3=date2['average_rating'].groupby(by=date2['original_publication_year']).mean
print(date3)
画图
#coding=utf-8
import pandas as pd
from matplotlib import pyplot as plt
file_path='./books.csv'
df=pd.read_csv(file_path)
#print(df.info())
#df2=df.groupby(by='original_publication_year').count()['book_id'].sort_values(ascending=False)
#print(df2)
#删除一列中有缺失的数据
date2=df[pd.notnull(df['original_publication_year'])]
grouped=date2['average_rating'].groupby(by=date2['original_publication_year']).mean()
#print(grouped)
_x=grouped.index
_y=grouped.values
#画图
plt.figure(figsize=(20,8),dpi=80)

plt.plot(range(len(_x)),_y)
#取步长,#小数替换成整数,旋转45度,#astype可以转换dateframe中的数据类型
plt.xticks(list(range(len(_x)))[::20],_x[::20].astype(int),rotation=45)
plt.show()
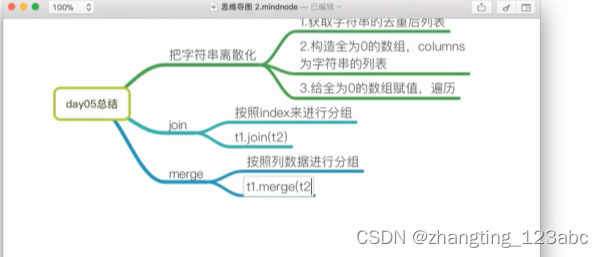
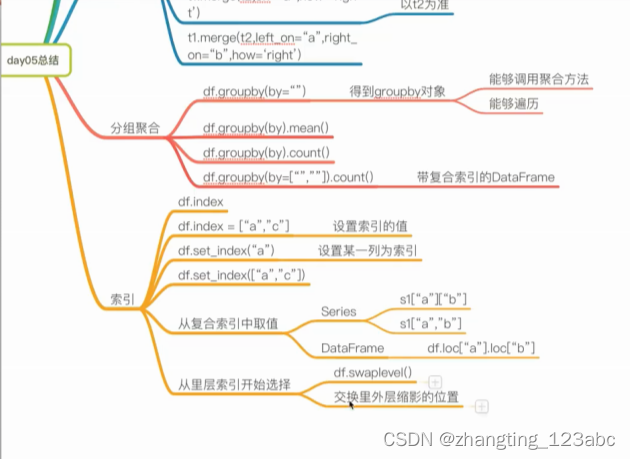
8:复习(day5总结)


 8502
8502

 被折叠的 条评论
为什么被折叠?
被折叠的 条评论
为什么被折叠?
 到【灌水乐园】发言


