引用格式:Hu, X., Shi, S., Zhou, B. et al. A 1 km monthly dataset of historical and future climate changes over China. Sci Data 12, 436 (2025). https://doi.org/10.1038/s41597-025-04761-y
一、数据概况
高分辨率气候数据对于了解气候变化对全球多个部门的影响非常重要。该研究利用1991—2020年的最新气象记录和最近更新的大气环流模式(GCMs),利用ANUSPLIN软件、delta校正(DC)降尺度和三次样条重采样方法,建立了一个30年平均0.01°(≈1 km)的气候数据集,包括5个基本气候变量和23个生物气候变量。每个变量包含1991-2020年的月度网格化历史数据和3个时期(2021-2040、2041-2070、2071-2100)、3种情景(SSP1-2.6、SSP2-4.5和SSP5-8.5)和10个gcm(包括一个集成模型)的经偏差校正的未来数据。ANUSPLIIN软件生成的历史插值结果与观测值拟合良好(高于0.91)。直流校正提高了大多数GCM原始模拟的精度,使偏差降低了0.69% ~ 58.63%。因此,该新数据集具有可靠的数据质量,并进一步为生态和气候影响研究提供高分辨率和偏差校正的中国长期平均历史和未来气候数据。

图1:中国气象站分布图。普通台站(N = 2093)是指所有5个基本变量数据都具备的台站。额外的站点(N = 92)是指除日照百分比以外有数据的站点。
二、研究方法
1.数据来源与处理
-
历史数据:基于2185个气象站(1991–2020年)构建30年平均数据集,包含5项基础变量(pr、tas等),遵循国际标准质量控制。
-
未来数据:选取9套CMIP6 GCMs,覆盖三SSP情景(SSP1-2.6、SSP2-4.5、SSP5-8.5)和三时期(2021–2100年)。
2.高分辨率数据生成
-
插值方法:利用ANUSPLIN软件(三元样条函数)生成1公里分辨率历史网格数据,引入高程和降水协变量提升精度。
-
生物气候变量:基于经典和改进模型(如STASH)计算23项指标,涵盖积温、蒸散量和干湿指数。
3.偏差校正与降尺度
-
Delta订正法:通过计算月尺度气候异常值(温度用绝对差,降水/日照用相对差),结合三次样条重采样,生成高分辨率未来数据。
-
多模型集成:以等权重平均生成集合模式数据,提升预测稳健性。
4.精度验证
-
插值误差:ANUSPLIN插值的R²>0.91,RMSE和MAE较低。
-
降尺度效果:DC法显著降低GCM偏差(0.69%–58.63%),PDF和泰勒图验证区域季节趋势一致性。
 图2:delta纠正(DC)降尺度方法的流程图
三、结果与验证
ANUSPLIN方法验证
-
历史气候模拟:ANUSPLIN对1991-2020年历史气候的模拟结果与观测记录趋势基本一致,呈现中国气温和降水从东南向西北递减等特征,但因西南部气象站稀疏,其平均值略低于观测记录。
-
插值质量:通过RMSE、MAE和R²评估,ANUSPLIN插值结果总体稳定可靠。气温变量tas的评估结果最佳且最稳定,而降水(pr)和日照百分比(sunp)在夏季波动较大。各变量在不同地区的RMSE、MAE均较低,R²高于0.92,即使在青藏高原(TP)等气象站稀疏地区,插值结果也优于预期。
Delta纠正方法(DC)性能

图3:1991–2020 年期间,ANUSPLIN 插值得到的年平均气温(a)、最高气温(b)、最低气温(c)、年平均降水量(d)以及年平均日照百分比(e)的插值曲面。所附曲线表示中国不同地区插值结果和观测记录的月度趋势
数据说明:数据来源网络收集,版权原作者所有。
数据集包含1991-2020年的月平均历史气候数据和基于多模型的偏差校正未来气候数据,涵盖5个基本气候变量和23个生物气候变量。数据以GeoTIFF格式提供,命名规则规范且包含详细信息,每个基本变量文件含12层对应12个月数据。
A 1 km monthly dataset of historical and future climate changes over ChinaThis dataset provides 30-year averaged climate data for both historical and future periods, with a spatial resolution of 0.01° × 0.01°. Historical data (1991–2020) are based on the China Surface Climate Standard Dataset and were interpolated using ANUSPLIN software. Future climate data are derived from CMIP6 simulations, bias-corrected using the Delta downscaling method. The dataset includes 10 models (9 Global Climate Models, namely, GCMs, and 1 ensemble model), 3 scenarios (SSP1-2.6, SSP2-4.5, and SSP5-8.5), and 3 future periods (2021–2040, 2041–2070, 2071–2100). For each period (or scenario), 28 climate variables are provided, including: 5 monthly basic climate variables (mean temperature, maximum temperature, minimum temperature, precipitation, and percentage of sunshine), and 23 bioclimatic variables based on the basic variables (for details, see the dataset documentation file).The data quality was strictly evaluated. The ANUSPLIN interpolated historical data showed a strong correlation with observations (all correlation coefficients above 0.91). The historical interpolations generated by the ANUSPLIIN software showed a good fit (above 0.91) with observations. The bias correction improved the accuracy of most GCM original simulations, reducing the bias by 0.69%–58.63%. This dataset aims to provide high-resolution, bias-corrected long-term historical and future climate data for climate and ecological research. All computations were performed using R, and the corresponding code can be found in the dataset folder: “Code”.All data are provided in GeoTIFF (.tif) format, where each file for the basic climate variables contains 12 bands, representing monthly data in ascending order (e.g., Band 1 corresponds to January). To facilitate data storage, all files are provided in compressed archives, following a consistent naming convention:(1) Historical data: China_Variable_1km_1991–2020.tifWhere, Variable represents the abbreviation of the 28 climate variables.Example: China_pr_1km_1991–2020.tif.(2) Future data: China_Variable_Model_VariantLabel_1km_StartYear-EndYear_Scenario.tifWhere, Variable is the 28 climate variables; Model is the GCM name; VariantLabel is r1i1p1f1 in this study; StartYear-EndYear is the future period; Scenario is the SSP climate scenarioExample: China_tasmin_MRI-ESM2-0_r1i1p1f1_1km_2071–2100_SSP585.tif. https://www.scidb.cn/en/detail?dataSetId=cece16f1863b4ebd839894f6df26f8ac
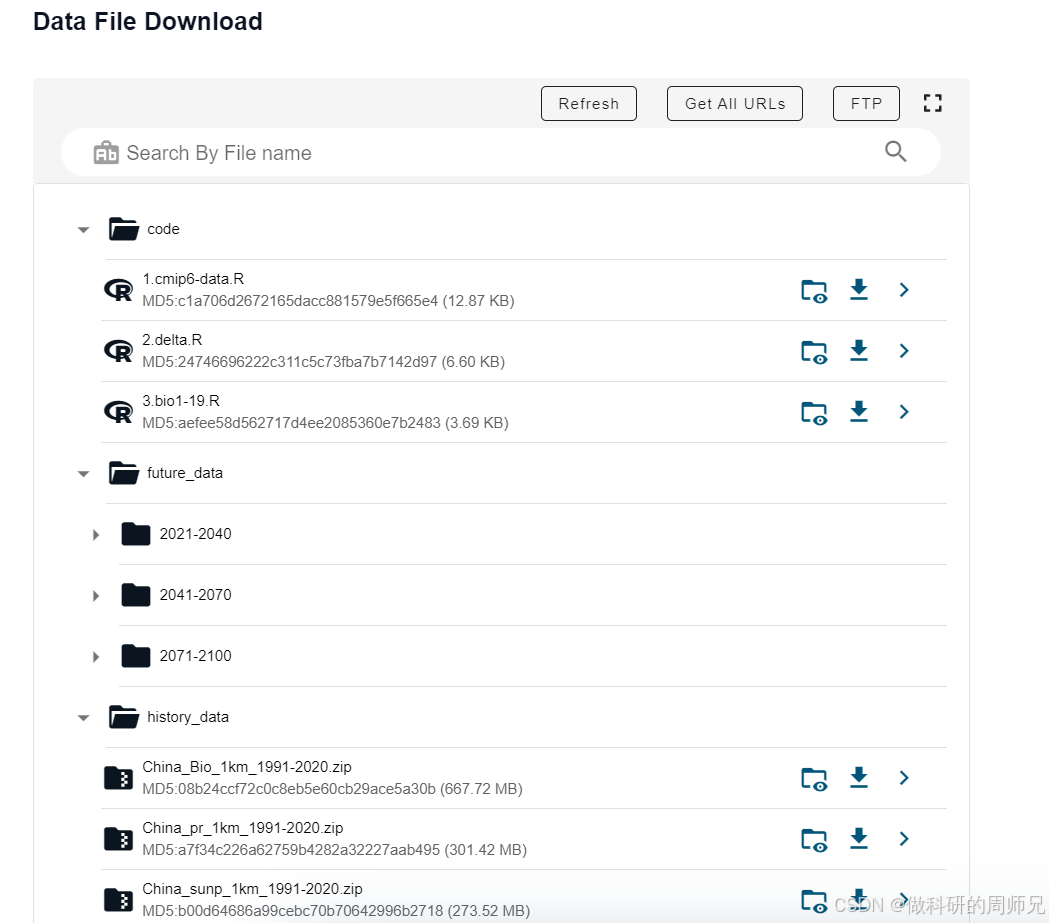


 818
818

 被折叠的 条评论
为什么被折叠?
被折叠的 条评论
为什么被折叠?
 到【灌水乐园】发言


