


 本文介绍了matplotlib库中Axes.scatter函数的用法,包括设置点的大小、颜色、形状及透明度等属性,并通过示例展示了不同参数的效果,帮助理解scatter函数在绘制散点图时的灵活性。
函数头:
def Axes.scatter(self, x, y, s=20, c='b', marker='o', cmap=None, norm=None, vmin=None, vmax=None, alpha=None, linewidths=None, verts=None, **kwargs)
返回:: PathCollection
要求:x,y必须是相同长度序列
----------
x,y:输入组,类似数组
Input data
实验:画三个点
fig1 = plt.figure(num='fig1',figsize=(6,3),dpi=75,facecolor='#FFFFFF',edgecolor='#FF0000')
plt.xlim(0,20)
plt.ylim(0,10)

x = [2,4,6]
y = [2,2,2]
plt.scatter(x,y)

plt.show()
plt.close()
s:点的大小(面积),标量或数组,缺省值为 (20*20)
size in points^2.
实验:
x = [2,4,6,8,10,14,18]
y = [2,2,2,2,2,2,2]
s = []
for i in x:
  s.append(i*i)
plt.scatter(x,y,s=s)
运行结果 :
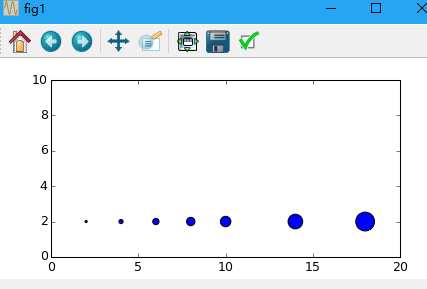
注意:s实际显示的最小尺寸受到linewidth的影响
c:颜色
`c` can be a single color format string, or a sequence of color
 最低0.47元/天 解锁文章


 3704
3704

 被折叠的 条评论
为什么被折叠?
被折叠的 条评论
为什么被折叠?
 到【灌水乐园】发言


