


Dataset
本文的数据集hollywood_movies.csv是好莱坞2007到2011年的电影的信息,可视化的目标是更好的理解好莱坞的基本经济以及探索电影成功的异常性质。
- 下面是csv文件中某些重要的属性
Year: the year the movie was released.
Critic Rating: average rating by the critics.
Audience Rating: average rating by the audience.
Genre: the genre the movie belongs to. (电影类型)
Budget: the movie’s budget, in millions of dollars.(国内(美国)收入)
Domestic Gross: domestic (U.S.) revenue, in millions of dollars.(国外收入)
Worldwide Gross: total revenue worldwide, in millions of dollars.(全球总收入)
Profitability: ratio of Budget to Worldwide Gross.
- 因为exclude这一列都是空值,因此用drop函数将其删掉
import matplotlib.pyplot as plt
import pandas as pd
import seaborn as sns

hollywood_movies = pd.read_csv("hollywood_movies.csv")
hollywood_movies = hollywood_movies.drop("exclude", axis=1)
Scatter Plots - Profitability And Audience Ratings
- 观察电影的收益与观众评论的关系
fig = plt.figure(figsize=(6,10))
ax1 = fig.add_subplot(2,1,1)
ax2 = fig.add_subplot(2,1,2)
ax1.scatter(hollywood_movies["Profitability"], hollywood_movies["Audience Rating"])
ax1.set_ylabel("Audience Rating")
ax1.set_xlabel("Profitability")
ax1.set_title("Hollywood Movies, 2007 - 2011")
ax2.scatter(hollywood_movies["Audience Rating"], hollywood_movies["Profitability"])
ax2.set_ylabel("Profitability")
ax2.set_xlabel("Audience Rating")
ax2.set_title("Hollywood Movies, 2007 - 2011")
plt.show()
Scatter Matrix - Profitability And Critic Ratings
上面两个图中都有一个离群点,因此需要过滤掉这个电影然后对其他的数据进行可视化。
- scatter_matrix函数优点类似Seaborn中的Pairplot函数,就是描述属性的两两匹配,但这里不同的是,只有两个属性,但是匹配的方式是调换横纵坐标并且刻画散点图和柱状图,总共产生四个图。
from pandas.tools.plotting import scatter_matrix
normal_movies = hollywood_movies[hollywood_movies["Profitability"] < 10000]
scatter_matrix(normal_movies[["Profitability", "Audience Rating"]], figsize=(6,6))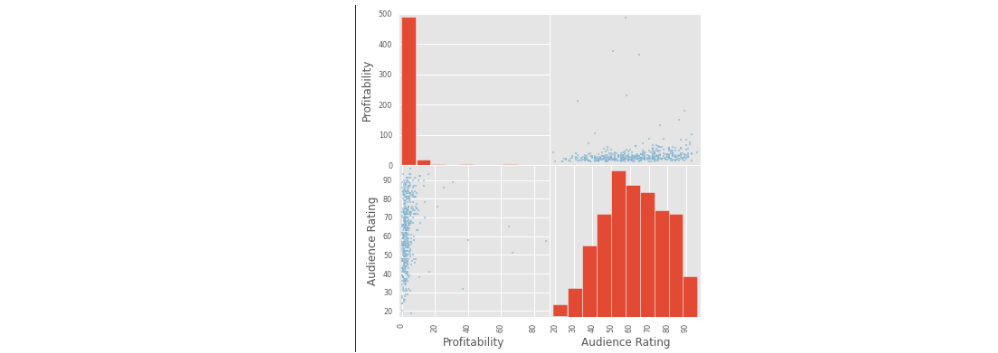
Box Plot - Audience And Critic Ratings
- 这里调用的是DataFrame自己的可视化工具,当然也是基于matplotlib的。
normal_movies[["Critic Rating", "Audience Rating"]].plot(kind="box")
Box Plot - Critic Vs Audience Ratings Per Year
- 可视化每年的观众评论和专家评论的盒图,利用Seaborn
fig = plt.figure(figsize=(8,4))
ax1 = fig.add_subplot(1,2,1)
ax2 = fig.add_subplot(1,2,2)
normal_movies = normal_movies.sort("Year")
sns.boxplot(data=normal_movies[pd.notnull(normal_movies["Genre"])], x="Year", y="Critic Rating", ax=ax1)
sns.boxplot(data=normal_movies[pd.notnull(normal_movies["Genre"])], x="Year", y="Audience Rating", ax=ax2)
plt.show()
Box Plots - Profitable Vs Unprofitable Movies
- 可视化盈利电影和非盈利电影,创建了一个属性Profitable:是否盈利
def is_profitable(row):
    if row["Profitability"] <= 1.0:
        return False
    return True
normal_movies["Profitable"] = normal_movies.apply(is_profitable, axis=1)
fig = plt.figure(figsize=(12,6))
ax1 = fig.add_subplot(1,2,1)
ax2 = fig.add_subplot(1,2,2)
sns.boxplot(x="Profitable", y="Audience Rating", data=normal_movies, ax=ax1)
sns.boxplot(x="Profitable", y="Critic Rating", data=normal_movies, ax=ax2)


 2510
2510

 被折叠的 条评论
为什么被折叠?
被折叠的 条评论
为什么被折叠?
 到【灌水乐园】发言


