


先来一个简单的例子:
from sklearn.metrics import roc_curve, auc
import matplotlib.pyplot as plt
import numpy as np
import numpy.random as r
size = 1000000
y_pred = r.random(size)
y_true = np.array([ 1 if i >= 0.5 else 0 for i in y_pred], dtype=np.float32)

y_cls = np.array([ 1 if i >= 0.7 else 0 for i in y_pred], dtype=np.float32)

false_positive_rate, true_positive_rate, thresholds = roc_curve(y_true, y_cls)
#True binary labels in range {0, 1} or {-1, 1}. If labels are not binary, pos_label should be explicitly given.
roc_auc = auc(false_positive_rate, true_positive_rate)
plt.title('Receiver Operating Characteristic')
plt.plot(false_positive_rate, true_positive_rate, 'b',
label='AUC = %0.2f'% roc_auc)
plt.legend(loc='lower right')
plt.plot([0,1],[0,1],'r--')

plt.ylabel('True Positive Rate')
plt.xlabel('False Positive Rate')
plt.savefig("C:\\roc1.png")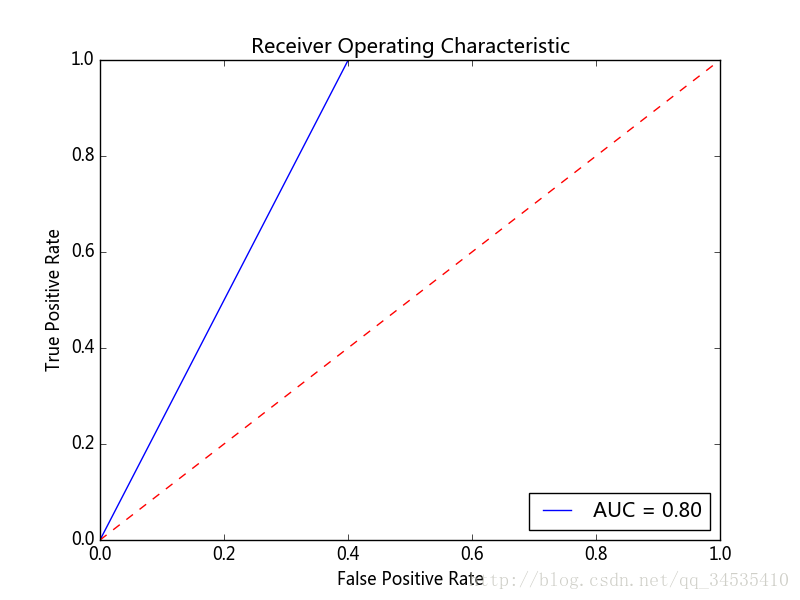
在SVM上的应用:
# -*- coding: utf-8 -*-
__author__ = 'zzw'
import numpy as np
import matplotlib.pyplot as plt
from itertools import cycle

from sklearn import svm, datasets
from sklearn.metrics import roc_curve, auc
from sklearn.preprocessing import label_binarize
from sklearn.multiclass import OneVsRestClassifier
from scipy import interp
import pandas as pd
# Import some data to play with
train_num = 500
test_num = 700
#data = pd.read_csv('F:\\iris.csv')
iris = datasets.load_iris()

X = iris.data
y = iris.target
y = label_binarize(y, classes=[0, 1, 2])
n_classes = y.shape[1]
#y = label_binarize(y, classes=[0, 1, 2])
'''
X_train = X[0:120]
y_train = y[0:120]
X_test = X[120:]
y_test = y[120:]'''
from sklearn.cross_validation import train_test_split
random_state = np.random.RandomState(0)
n_samples, n_features = X.shape
X = np.c_[X, random_state.randn(n_samples, 200 * n_features)]
X_train, X_test, y_train, y_test = train_test_split(X, y, test_size=.5,
                                                    random_state=0)
# Learn to predict each class against the other
classifier = OneVsRestClassifier(svm.SVC(kernel='linear'))

y_score = classifier.fit(X_train, y_train).decision_function(X_test)

# Compute ROC curve and ROC area for each class
#print y_score

fpr = dict()
tpr = dict()
roc_auc = dict()
for i in range(3):
    fpr[i], tpr[i], _ = roc_curve(y_test[:, i], y_score[:, i])
    roc_auc[i] = auc(fpr[i], tpr[i])
plt.figure()
lw = 2
colors = cycle(['aqua', 'darkorange', 'cornflowerblue'])
for i, color in zip(range(3), colors):
    plt.plot(fpr[i], tpr[i], color=color,lw=lw, label='ROC curve (area = %0.2f)' % roc_auc[i])
plt.plot([0, 1], [0, 1], color='navy', lw=lw, linestyle='--')
plt.xlim([0.0, 1.0])
plt.ylim([0.0, 1.05])
plt.xlabel('False Positive Rate')
plt.ylabel('True Positive Rate')
plt.title('Receiver operating characteristic example')
plt.legend(loc="lower right")
plt.show()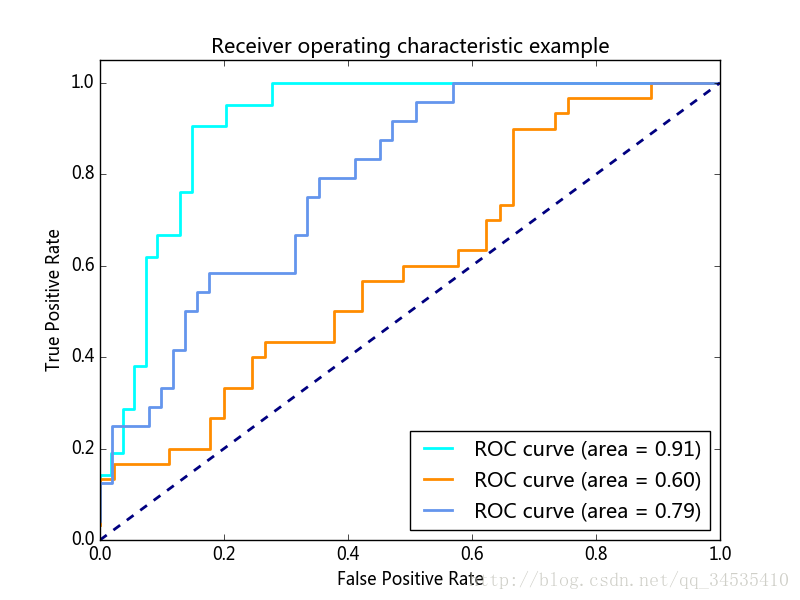


 2421
2421


 被折叠的 条评论
为什么被折叠?
被折叠的 条评论
为什么被折叠?
 到【灌水乐园】发言


