


最后
不知道你们用的什么环境,我一般都是用的Python3.6环境和pycharm解释器,没有软件,或者没有资料,没人解答问题,都可以免费领取(包括今天的代码),过几天我还会做个视频教程出来,有需要也可以领取~
给大家准备的学习资料包括但不限于:
Python 环境、pycharm编辑器/永久激活/翻译插件
python 零基础视频教程
Python 界面开发实战教程
Python 爬虫实战教程
Python 数据分析实战教程
python 游戏开发实战教程
Python 电子书100本
Python 学习路线规划

网上学习资料一大堆,但如果学到的知识不成体系,遇到问题时只是浅尝辄止,不再深入研究,那么很难做到真正的技术提升。
一个人可以走的很快,但一群人才能走的更远!不论你是正从事IT行业的老鸟或是对IT行业感兴趣的新人,都欢迎加入我们的的圈子(技术交流、学习资源、职场吐槽、大厂内推、面试辅导),让我们一起学习成长!
    itemss = (str(items[0])).split(" ")
    items0 = itemss[1]
    csv_str += '"'+items0+'",'+items[1]+','+items[2]+','+items[3]+','+items[4]+'\n'
csv_create(filepath+"/"+a_date[0]+".csv",csv_str)
for item in arr:
url = “http://pdfm.eastmoney.com/EM_UBG_PDTI_Fast/api/js?rtntype=5&id=”+item[3]+item[1]+“&type=r&iscr=false”
data = getData(url)
item2 = item[2].replace(“*”,“”)
tranformToCSV(data,“D://gp/”+str(gp_count)+“、”+item2+item[3]) #股票信息的保存路径是(D://pg/序号+股票名字+股票代号/日期.csv)
gp_count = gp_count+1;
# 使用 DebugLog
db.commit()
db.close()
get\_gp\_detail.py程序正确运行之后,D盘中将会出现我们所需要的数据,如下图:


3、对数据进行简单呈现plt\_show.py:
import pandas as pd
import numpy as np
import matplotlib.pyplot as plt
o=open(‘D:/gp/1045、广州港601228/2019-04-01.csv’)
table = pd.read_csv(o)
plt.plot(table[‘time’], table[‘first’])
plt.rcParams[‘figure.figsize’] = (30.0, 20.0)
plt.show()
pd.to_numeric(table[“first”],errors=“ignore”)
#print(table[“first”])
max = np.argmax(table[“first”],axis=1)
min = np.argmin(table[“first”],axis=0)
wave_price = table[“first”][max]-table[“first”][min]
wave_price_rate = wave_price/table[“first”][0]
final_wave_price = table[“first”][240]-table[“first”][0]
final_wave_price_rate = final_wave_price/table[‘first’][0]
print(“最大值”+str(table[“first”][max]))
print(“最小值”+str(table[“first”][min]))
print(“波动区间”+str(wave_price))
print(“波动幅度%.2f%%”% (wave_price_rate * 100))
print(“最终价格差距”+str(final_wave_price))
print(‘最终价格幅度%.2f%%’ % (final_wave_price_rate * 100))
效果图:

4、对所有股票数据进行简单的筛选和分析,筛选出2019-04-12,当天下午两点到三点之间,突然拉伸超过3%的所有股票并且保存进数据库find\_feature.py:
import pymysql
import pandas as pd
import numpy as np
import matplotlib.pyplot as plt
#连接数据库
db = pymysql.connect(host=‘127.0.0.1’,user=‘root’,password=‘root’,db=‘gp_db’,port=3306)
#获取cursor
cursor = db.cursor()
time = “2019-04-12”
def find_feature(path,name,gpid):
o=open(path)
table = pd.read_csv(o)
table[‘time’] = pd.to_datetime(table[“time”])
table = table.set_index(‘time’,drop=False) #排序之后,日期会是当前日期加上时间
table = table[“2019-04-12 14:00:00”:“2019-04-12 15:00:00”]
#print(table)
if(table[‘first’].empty):
return
try:
#print(table[‘first’])
max = np.argmax(table[“first”])
min = np.argmin(table[“first”])
    wave_price = table["first"][max]-table["first"][min]
    final_wave_price = table["first"][60]-table["first"][0]
    wave_price_rate = 0
    final_wave_price_rate = 0
    if table["first"][0] != 0:
        wave_price_rate = wave_price/table["first"][0]
        final_wave_price_rate = final_wave_price/table['first'][0]
    if  final_wave_price_rate > 0.03:
        print(name+gpid)
        print("波动幅度%.2f%%"% (wave_price_rate * 100))
        print('最终价格幅度%.2f%%' % (final_wave_price_rate * 100))
        cursor.execute('insert into special_gp(gpfeature,gpname,gpid,gptime) values(%s,%s,%s,%s)',(1,str(gp_count)+"、"+name,gpid,time))
except:
    pass
sql = “select * from gp”
cursor.execute(sql)
print(“SELECT OK”)
#all_gp = cursor.fetchmany(1)
all_gp = cursor.fetchall()
arr = np.array(all_gp)
gp_count = 1
for item in arr:
item2 = item[2].replace(“*”,“”)
path = “D://gp/”+str(gp_count)+“、”+item2+item[3]+“/”+time+“.csv”
find_feature(path,item2,item[3])
gp_count = gp_count+1;
db.commit()
db.close()
效果图:

以上即为股票当天数据爬取及数据分析,注意:每天股票的详细数据必须在第二天开市之前进行抓取,否则便再也抓取不到。
**另外怕大家不会使用,直接给大家准备了写好的,直接下载打开即可使用!**
**源码放在百度云盘上了需要可以微信扫描下方CSDN官方认证二维码免费领取【保证100%免费】**

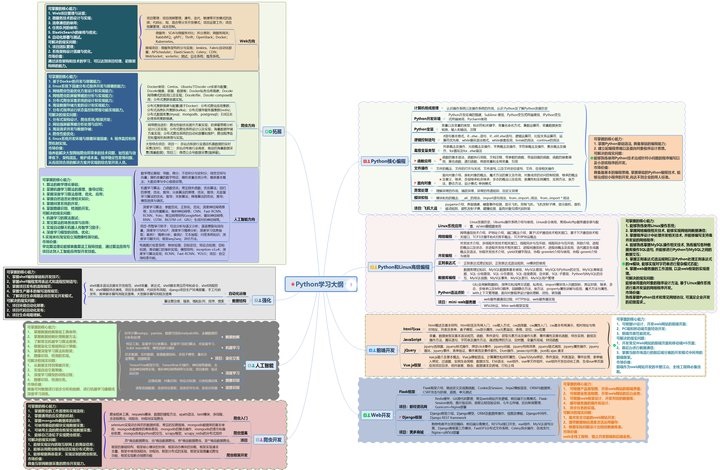
#### 一、Python学习大纲
Python所有方向的技术点做的整理,形成各个领域的知识点汇总,它的用处就在于,你可以按照上面的知识点去找对应的学习资源,保证自己学得较为全面。
#### 二、入门学习视频

#### 三、实战案例
光学理论是没用的,要学会跟着一起敲,要动手实操,才能将自己的所学运用到实际当中去,这时候可以搞点实战案例来学习。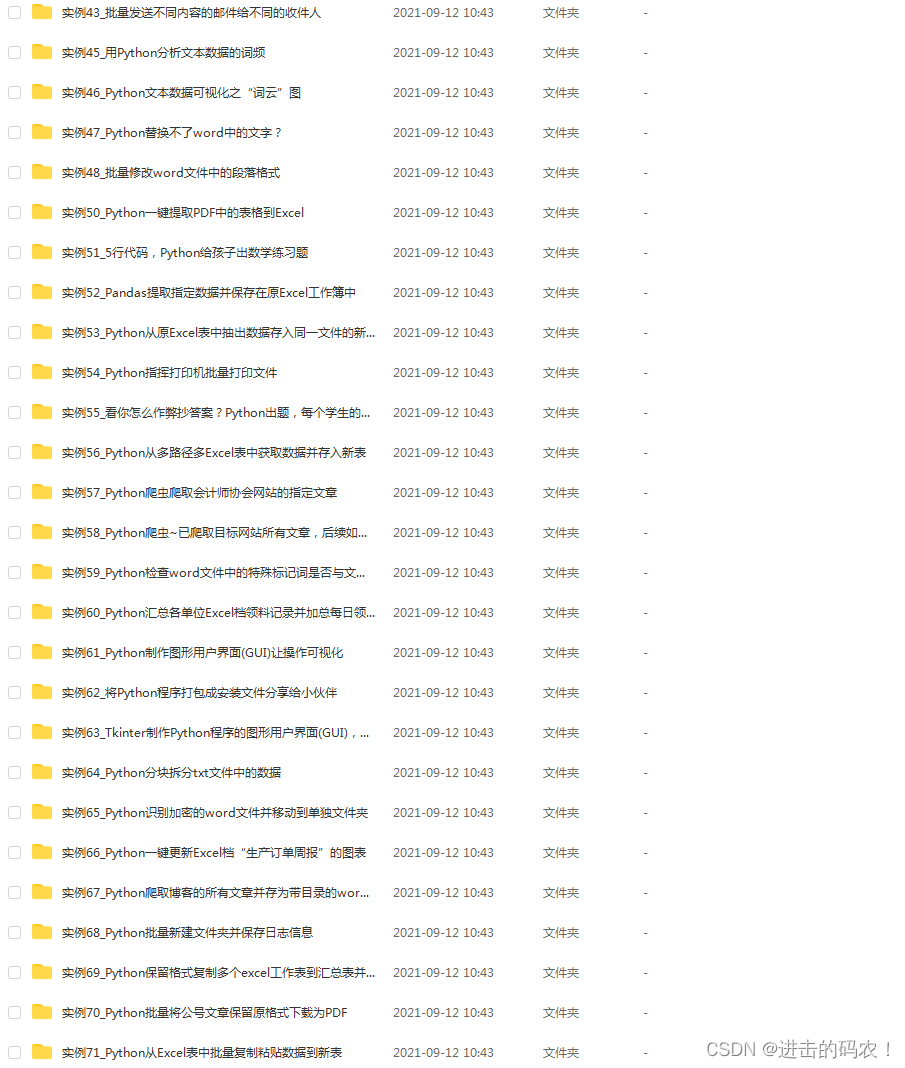
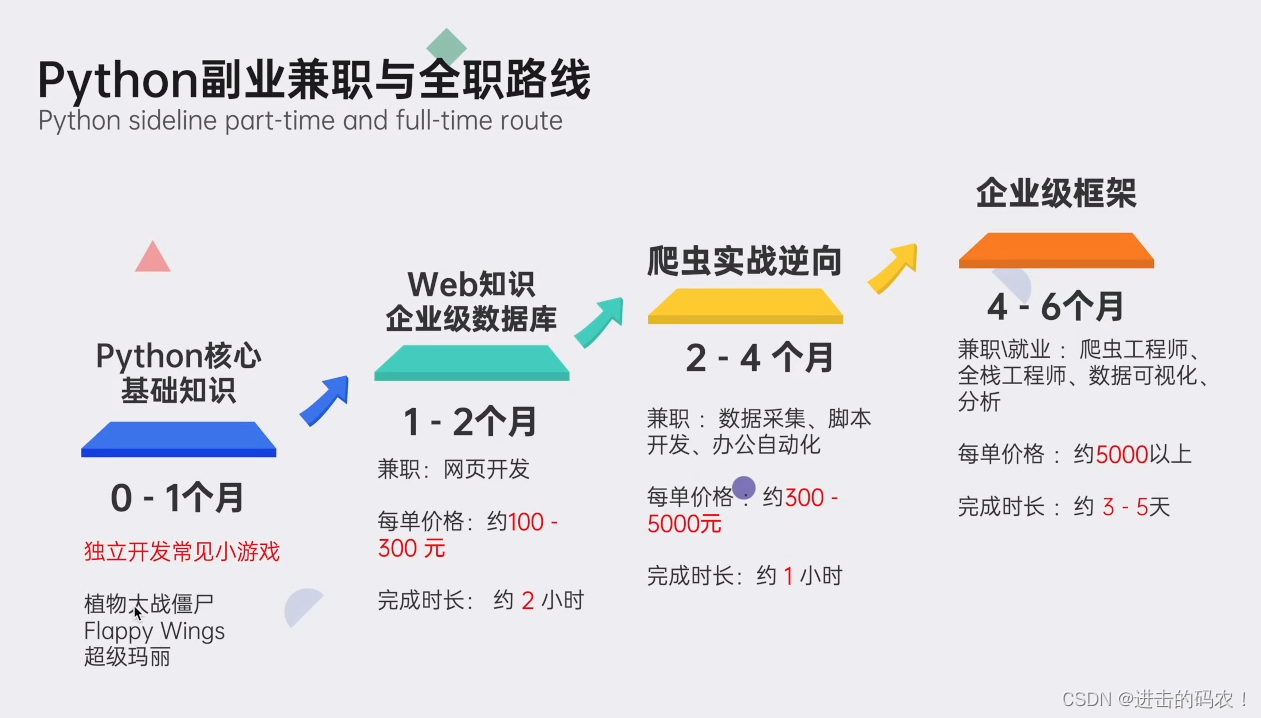
#### 四、python副业兼职与全职路线
**上面的所有资料我全部打包好了并且上传至CSDN官方,需要的点击👇获取!**
###
[👉 [Python零基础2023入门资料包] 👈]( )

**感谢每一个认真阅读我文章的人,看着粉丝一路的上涨和关注,礼尚往来总是要有的:**
① 2000多本Python电子书(主流和经典的书籍应该都有了)
② Python标准库资料(最全中文版)
③ 项目源码(四五十个有趣且经典的练手项目及源码)
④ Python基础入门、爬虫、web开发、大数据分析方面的视频(适合小白学习)
⑤ Python学习路线图(告别不入流的学习)
**网上学习资料一大堆,但如果学到的知识不成体系,遇到问题时只是浅尝辄止,不再深入研究,那么很难做到真正的技术提升。**
**[需要这份系统化学习资料的朋友,可以戳这里获取](https://bbs.csdn.net/forums/4304bb5a486d4c3ab8389e65ecb71ac0)**
**一个人可以走的很快,但一群人才能走的更远!不论你是正从事IT行业的老鸟或是对IT行业感兴趣的新人,都欢迎加入我们的的圈子(技术交流、学习资源、职场吐槽、大厂内推、面试辅导),让我们一起学习成长!**


 2701
2701

 被折叠的 条评论
为什么被折叠?
被折叠的 条评论
为什么被折叠?
 到【灌水乐园】发言


