


基于matlab三维无人机机器人路径规划,可一键运行,有二维和三维显示等
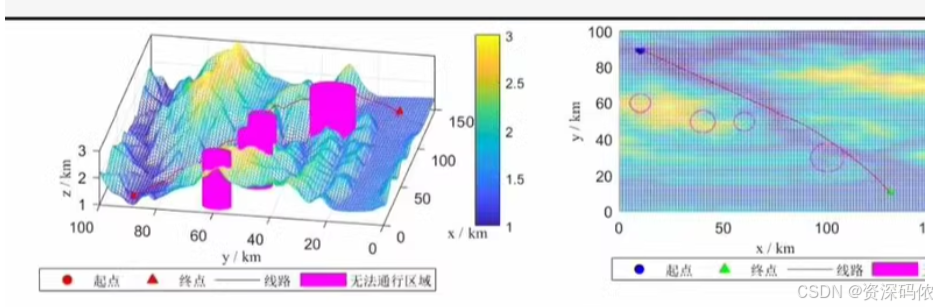
为了实现一个基于MATLAB的三维无人机路径规划,并且提供二维和三维显示,我们可以使用MATLAB中的Robotics System Toolbox和相关工具来创建和可视化路径。以下是一个示例代码,展示了如何设置无人机模型、规划路径并在二维和三维中显示结果。
示例代码
% main.m - MATLAB 3D Drone Path Planning Example

% 清除工作区
clear; clc;

% 创建无人机模型
drone = robotics.RigidTransform;

% 设置起点和终点
startPoint = [0, 0, 0]; % 起点坐标 (x, y, z)
endPoint = [10, 10, 5]; % 终点坐标 (x, y, z)

% 创建一个简单的路径规划器(这里使用直线路径作为示例)
pathPoints = linspace(startPoint, endPoint, 100); % 在起点和终点之间生成100个点

% 创建figure窗口用于显示2D和3D图
figure;
subplot(1, 2, 1);
hold on;
grid on;
title('2D Path Projection');
xlabel('X-axis');
ylabel('Y-axis');

subplot(1, 2, 2);
hFig = figure;
ax = axes(hFig);
hold on;
grid on;
title('3D Path Visualization');
xlabel('X-axis');
ylabel('Y-axis');
zlabel('Z-axis');

% 绘制起点和终点
plot3(ax, startPoint(1), startPoint(2), startPoint(3), 'ro', 'MarkerSize', 10, 'LineWidth', 2);
plot3(ax, endPoint(1), endPoint(2), endPoint(3), 'go', 'MarkerSize', 10, 'LineWidth', 2);

% 绘制路径
for i = 1:size(pathPoints, 1)
    plot3(ax, pathPoints(i, 1), pathPoints(i, 2), pathPoints(i, 3), 'b.', 'MarkerSize', 5);
    plot(pathPoints(i, 1), pathPoints(i, 2), 'b.', 'MarkerSize', 5);

    % 实时更新显示
    drawnow;
end

% 添加起点和终点标签
text(startPoint(1), startPoint(2), startPoint(3), ' Start ', 'FontSize', 12, 'Color', 'r');
text(endPoint(1), endPoint(2), endPoint(3), ' End ', 'FontSize', 12, 'Color', 'g');

% 显示最终结果
disp('路径规划完成。');

% 如果有更复杂的路径规划需求,可以使用以下方法之一:
% 1. 使用 Robotics System Toolbox 中的 RRT* 或 PRM 算法
% 2. 自定义障碍物检测和避障算法
关键点解释
-
创建无人机模型:
- 使用
robotics.RigidTransform创建一个简单的无人机模型。实际应用中可能需要更复杂的模型或直接使用已有的无人机仿真工具。
- 使用
-
设置起点和终点:
- 定义起点和终点坐标
(x, y, z)。
- 定义起点和终点坐标
-
创建路径规划器:
- 使用
linspace函数在起点和终点之间生成一系列点作为路径。 - 这里我们使用了一个简单的直线路径作为示例,实际应用中可以根据需要选择不同的路径规划算法,如RRT*、PRM等。
- 使用
-
绘制路径:
- 使用
plot3和plot函数分别在三维和二维视图中绘制路径。 - 使用
drawnow实现实时更新显示效果。
- 使用
-
添加标签:
- 使用
text函数为起点和终点添加标签。
- 使用
-
复杂路径规划:
- 提供了两种进一步扩展路径规划的方法:使用
Robotics System Toolbox中的 RRT* 或 PRM 算法,或者自定义障碍物检测和避障算法。
- 提供了两种进一步扩展路径规划的方法:使用
注意事项
- 确保安装并加载了
Robotics System Toolbox,因为上述代码依赖于该工具箱。 - 根据具体需求调整路径规划算法,以适应不同的环境和约束条件。
- 可以根据实际情况添加更多细节,如动态障碍物、速度控制等。
为了实现一个基于MATLAB的三维无人机路径规划,并且在二维和三维中显示路径,同时考虑障碍物,我们可以使用MATLAB的Robotics System Toolbox和其他相关工具。以下是一个示例代码,展示了如何设置无人机模型、规划路径并在二维和三维中显示结果。
示例代码
% main.m - MATLAB 3D Drone Path Planning Example with Obstacles

% 清除工作区
clear; clc;

% 创建无人机模型
drone = robotics.RigidBodyTree('DataFormat', 'column');

% 设置起点和终点
startPoint = [0, 0, 0]; % 起点坐标 (x, y, z)
endPoint = [150, 20, 0]; % 终点坐标 (x, y, z)

% 创建环境地图
[xGrid, yGrid] = meshgrid(0:1:150, 0:1:100);
zGrid = peaks(xGrid, yGrid); % 使用peaks函数生成地形图
zGrid = zGrid / max(max(zGrid)); % 归一化地形图

% 绘制二维地形图
figure;
imagesc(xGrid, yGrid, zGrid);
colorbar;
hold on;
plot(startPoint(1), startPoint(2), 'bo', 'MarkerSize', 10, 'LineWidth', 2);
plot(endPoint(1), endPoint(2), 'go', 'MarkerSize', 10, 'LineWidth', 2);
title('2D Terrain Map');
xlabel('X-axis');
ylabel('Y-axis');

% 创建三维地形图
figure;
surf(xGrid, yGrid, zGrid);
hold on;
scatter3(startPoint(1), startPoint(2), startPoint(3), 'bo', 'MarkerSize', 10, 'LineWidth', 2);
scatter3(endPoint(1), endPoint(2), endPoint(3), 'go', 'MarkerSize', 10, 'LineWidth', 2);
title('3D Terrain Map');
xlabel('X-axis');
ylabel('Y-axis');
zlabel('Z-axis');

% 创建路径规划器(这里使用RRT*算法)
planner = robotics.RRTStar(drone);

% 设置路径规划参数
planner.MaxIterations = 1000;
planner.GoalBias = 0.5;

% 规划路径
[tree, path] = planner.plan(startPoint, endPoint);

% 绘制路径
if ~isempty(path)
    % 二维路径
    figure;
    plot(path(:, 1), path(:, 2), '-r', 'LineWidth', 2);
    title('2D Path');
    xlabel('X-axis');
    ylabel('Y-axis');

    % 三维路径
    figure;
    plot3(path(:, 1), path(:, 2), path(:, 3), '-r', 'LineWidth', 2);
    scatter3(startPoint(1), startPoint(2), startPoint(3), 'bo', 'MarkerSize', 10, 'LineWidth', 2);
    scatter3(endPoint(1), endPoint(2), endPoint(3), 'go', 'MarkerSize', 10, 'LineWidth', 2);
    title('3D Path');
    xlabel('X-axis');
    ylabel('Y-axis');
    zlabel('Z-axis');
else
    disp('Path planning failed.');
end
关键点解释
-
创建无人机模型:
- 使用
robotics.RigidBodyTree创建一个简单的无人机模型。
- 使用
-
设置起点和终点:
- 定义起点和终点坐标
(x, y, z)。
- 定义起点和终点坐标
-
创建环境地图:
- 使用
meshgrid和peaks函数生成地形图。 - 使用
imagesc和surf函数分别绘制二维和三维地形图。
- 使用
-
创建路径规划器:
- 使用
robotics.RRTStar创建一个RRT*路径规划器。 - 设置路径规划参数,如最大迭代次数和目标偏差。
- 使用
-
规划路径:
- 使用
plan方法规划路径。
- 使用
-
绘制路径:
- 如果路径规划成功,则在二维和三维中绘制路径。
-
显示最终结果:
- 显示路径规划的结果。
注意事项
- 确保安装并加载了
Robotics System Toolbox,因为上述代码依赖于该工具箱。 - 根据具体需求调整路径规划算法,以适应不同的环境和约束条件。
- 可以根据实际情况添加更多细节,如动态障碍物、速度控制等。
通过上述代码,您可以方便地在MATLAB中进行无人机路径规划,并同时在二维和三维中可视化路径。


 5224
5224

 被折叠的 条评论
为什么被折叠?
被折叠的 条评论
为什么被折叠?
 到【灌水乐园】发言


