


这里直接展示代码了,更加详细的python绘制温度和风场风速图看我的前一篇文章:WRF输出结果可视化:python绘制温度风场图
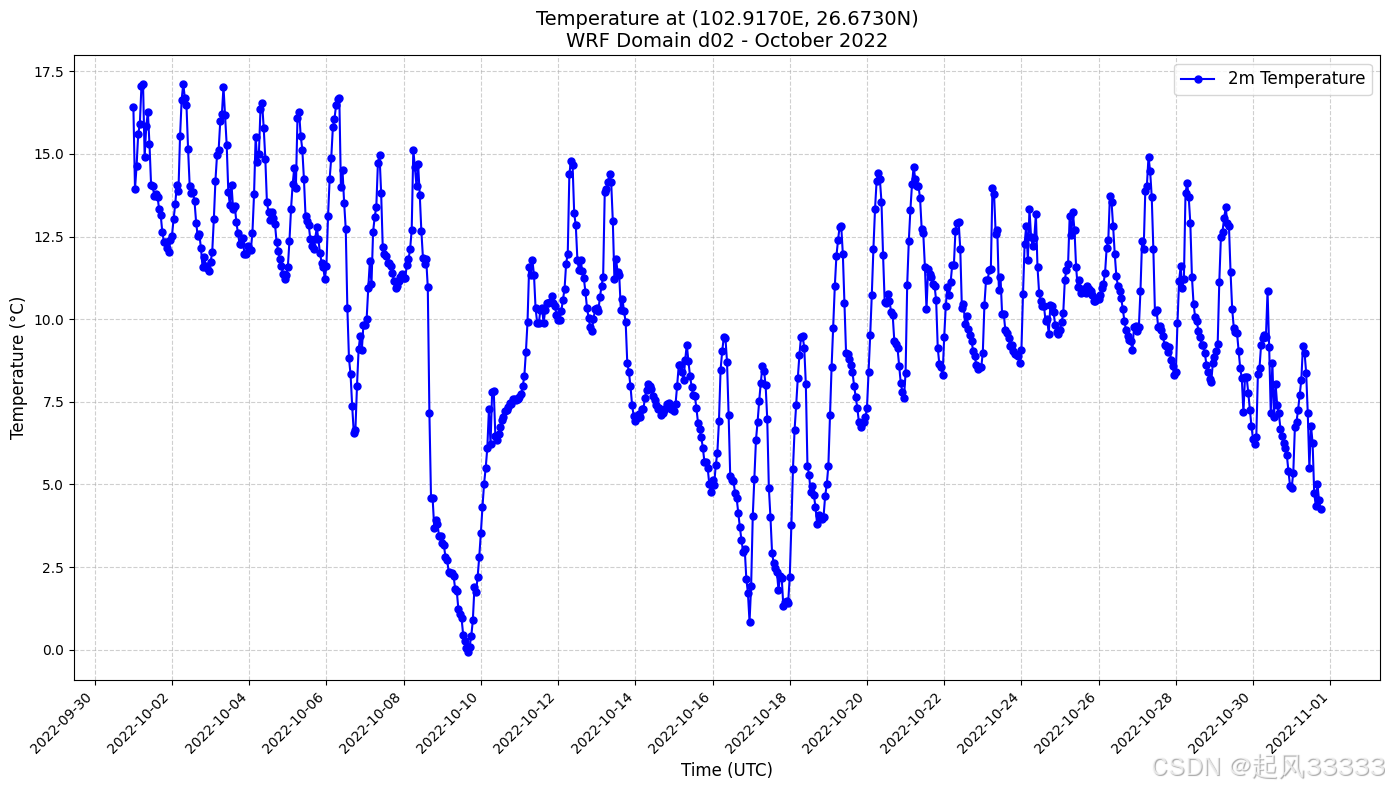
温度折线图效果展示
代码如下,其中的路径和目标经纬度换成自己的呀
import numpy as np
import netCDF4 as nc
import matplotlib.pyplot as plt
import matplotlib.dates as mdates
from datetime import datetime

# 解决路径转义问题(Windows系统需要)
file_path = r'F:\WRF\out\success\2022.10.1-31\wrfout_d02_2022-10-01_00%3A00%3A00'

try:
    # 读取WRF输出文件
    dataset = nc.Dataset(file_path)

    # 提取地理坐标
    lons = dataset.variables['XLONG'][0, :, :]
    lats = dataset.variables['XLAT'][0, :, :]

    # 目标经纬度点
    target_lon = 102.917
    target_lat = 26.673

    # 找到最接近目标经纬度的网格点索引
    lon_diff = np.abs(lons - target_lon)
    lat_diff = np.abs(lats - target_lat)
    min_index = np.unravel_index((lon_diff + lat_diff).argmin(), lon_diff.shape)
    i, j = min_index

    print(f"Selected grid point index: ({i}, {j})")
    print(f"Closest longitude: {lons[i, j]}, Closest latitude: {lats[i, j]}")

    # 提取并转换温度数据(K → ℃)
    if 'T2' in dataset.variables:
        temp_k = dataset.variables['T2'][:, i, j]
        temp_c = temp_k - 273.15
    else:
        raise ValueError("T2 variable not found in the dataset")

    # 提取时间信息并转换为datetime对象
    times = dataset.variables['Times']
    time_strs = [''.join(map(lambda x: x.decode('utf-8'), t)).strip() for t in times[:]]
    time_dates = [datetime.strptime(t, '%Y-%m-%d_%H:%M:%S') for t in time_strs]

    # 创建折线图
    plt.figure(figsize=(14, 8))
    plt.plot(time_dates, temp_c, marker='o', linestyle='-', color='b', markersize=5, label='2m Temperature')

    # 设置图形属性
    plt.xlabel('Time (UTC)', fontsize=12)
    plt.ylabel('Temperature (°C)', fontsize=12)
    plt.title(f'Temperature at ({target_lon:.4f}E, {target_lat:.4f}N)\nWRF Domain d02 - October 2022', fontsize=14)

    # 格式化时间轴
    plt.gca().xaxis.set_major_formatter(mdates.DateFormatter('%Y-%m-%d'))
    plt.gca().xaxis.set_major_locator(mdates.DayLocator(interval=2))
    plt.xticks(rotation=45, ha='right')

    # 添加网格和图例
    plt.grid(True, linestyle='--', alpha=0.6)
    plt.legend(fontsize=12)

    # 调整布局
    plt.tight_layout()

    # 保存图形为高分辨率图片
    plt.savefig('temperature_time_series.png', dpi=300, bbox_inches='tight')

    # 显示图形
    plt.show()

except Exception as e:
    print(f"Error occurred: {str(e)}")
finally:
    if 'dataset' in locals():
        dataset.close()
今天有点累了就不详细写了


 4111
4111

 被折叠的 条评论
为什么被折叠?
被折叠的 条评论
为什么被折叠?
 到【灌水乐园】发言


