


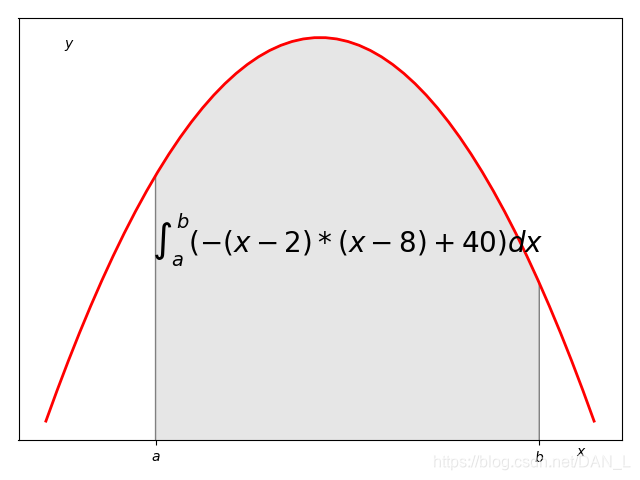
 本文展示如何使用Python的matplotlib库来绘制一个函数的积分图。通过定义一个二次函数,设置积分的边界a和b,然后创建并添加一个梯形区域来表示积分,最后在图形上添加了文字说明。
import numpy as np
import matplotlib.pyplot as plt
from matplotlib.patches import Polygon
def func(x):
return -(x-2)*(x-8)+40
x=np.linspace(0,10)
y=func(x)
fig,ax=plt.subplots()
plt.plot(x,y,‘r’,linewidth=2)
a = 2
b = 9
ax.set_xticks([a,b])
ax.set_yticks([])
ax.set_xticklabels([’
a
a
a’,’
b
b
b’])
ix=np.linspace(a,b)
iy=func(ix)
ixy=zip(ix,iy)
verts=[(a,0)]+list(ixy)+[(b,0)]
poly=Polygon(verts,facecolor=‘0.9’,edgecolor=‘0.5’)
ax.add_patch(poly)
plt.figtext(0.9,0.05,’
x
x
x’)
plt.figtext(0.1,0.9,’
y
y
y’)
x_math=(a+b)*0.5
y_math=35
plt.text(x_math,y_math,r’
∫
a
b
(
−
(
x
−
2
)
∗
(
x
−
8
)
+
40
)
d
x
\int_a^b (-(x-2)*(x-8)+40)dx
∫ab(−(x−2)∗(x−8)+40)dx’,
fontsize=20,horizontalalignment=‘center’)
plt.show()


 3017
3017
03-11

 被折叠的 条评论
为什么被折叠?
被折叠的 条评论
为什么被折叠?
 到【灌水乐园】发言


