


主博客
Python 各种画图
Part.I 理论
导入画图的模块matplotlib.pyplot
import matplotlib.pyplot as plt # 导入模块
Chap.I ax.tick_params 函数参数
ax.tick_params()函数可以对坐标轴进行一些控制,下面是它的参数的含义(实际上列下来也不太常看,用的时候直接复制粘贴即可)
Parameters
----------
axis : {'x', 'y', 'both'}, default: 'both'
    The axis to which the parameters are applied.
which : {'major', 'minor', 'both'}, default: 'major'
    The group of ticks to which the parameters are applied.
reset : bool, default: False
    Whether to reset the ticks to defaults before updating them.

Other Parameters
----------------
direction : {'in', 'out', 'inout'}
    Puts ticks inside the axes, outside the axes, or both.
length : float
    Tick length in points.
width : float
    Tick width in points.
color : color
    Tick color.
pad : float
    Distance in points between tick and label.
labelsize : float or str
    Tick label font size in points or as a string (e.g., 'large').
labelcolor : color
    Tick label color.
colors : color
    Tick color and label color.
zorder : float
    Tick and label zorder.
bottom, top, left, right : bool
    Whether to draw the respective ticks.
labelbottom, labeltop, labelleft, labelright : bool
    Whether to draw the respective tick labels.
labelrotation : float
    Tick label rotation
grid_color : color
    Gridline color.
grid_alpha : float
    Transparency of gridlines: 0 (transparent) to 1 (opaque).
grid_linewidth : float
    Width of gridlines in points.
grid_linestyle : str
    Any valid `.Line2D` line style spec.
常用的参数有
- axis: 它可取的值有
'x', 'y', 'both',默认是'both'。就是对谁发挥作用 - colors: 颜色,默认是黑色
- direction: 朝向,可取的值有
'in', 'out', 'inout' - length, width: 小短线长度和宽度
- pad: 小短线到文字的距离
Chap.II 常用语法
一般可以通过axis或者直接使用plt来修改ticks,下面是常用的操作(以xticks为例,yticks只需以y替换x即可)
ax.set_xticks(xticks)									# 设置xticks
ax.set_xticklabels(labels, rotation=-30, fontsize=15)	# 设置xticklab, 旋转角度 正逆时针,负顺时针
plt.xticks(ticks, labels, rotation=-30, fontsize=15)    # 上面两句合起来
实际上可用通过plt来获取axis
ax=plt.gca()
虽然可以通过fontsize来控制字体的大小,但是现在如果想改变字体的粗细和样式呢?可以进行如下的操作
x1_label = ax.get_xticklabels()
[x1_label_temp.set_font(font3) for x1_label_temp in x1_label]
上面这两句话的意思就是:首先通过ax.get_xticklabels获取到xticklabels,然后通过set_font来改变字体的样式,其中font3是一个字典类型的字体样式。
另外,还可以通过ax.tick_params修改坐标轴刻度的朝向,下面是笔者常用的一句话。
ax.tick_params(axis='both', colors='black', direction='out', labelsize=15, width=1, length=1, pad=5)
杂记
# 控制 x ticklable 显示的位置(上方,默认是下方),都设为 false 表示不显示
ax.tick_params(top=True, labeltop=True, bottom=False, labelbottom=False)
# 控制 y ticklable 显示的位置(右边,默认是左边),都设为 false 表示不显示
ax.tick_params(right=True, labelright=True, left=False, labelleft=False)
Part.II 实操
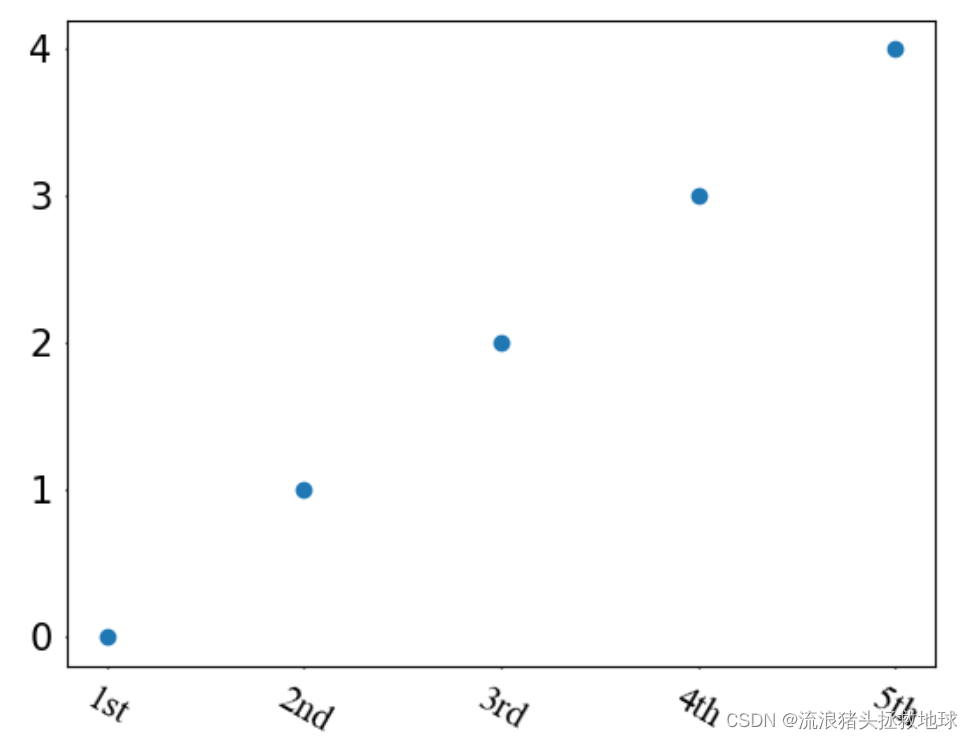
下面举个例子
import matplotlib.pyplot as plt

font3 = {'weight': 400, 'size': 13, 'family':'Times New Roman'} # xlabes
x=list(range(5))
y=x
plt.scatter(x,y)
xticks=x
labels=['1st','2nd','3rd','4th','5th']
ax=plt.gca()
plt.xticks(xticks, labels, rotation=-30, fontsize=15)
x1_label = ax.get_xticklabels()
[x1_label_temp.set_font(font3) for x1_label_temp in x1_label]
ax.tick_params(axis='both', colors='black', direction='out', labelsize=15, width=1, length=1, pad=5)
plt.show()


 1546
1546

 被折叠的 条评论
为什么被折叠?
被折叠的 条评论
为什么被折叠?
 到【灌水乐园】发言


