


欢迎大家关注全网生信学习者系列:
- WX公zhong号:生信学习者
- Xiao hong书:生信学习者
- 知hu:生信学习者
- CDSN:生信学习者2
介绍
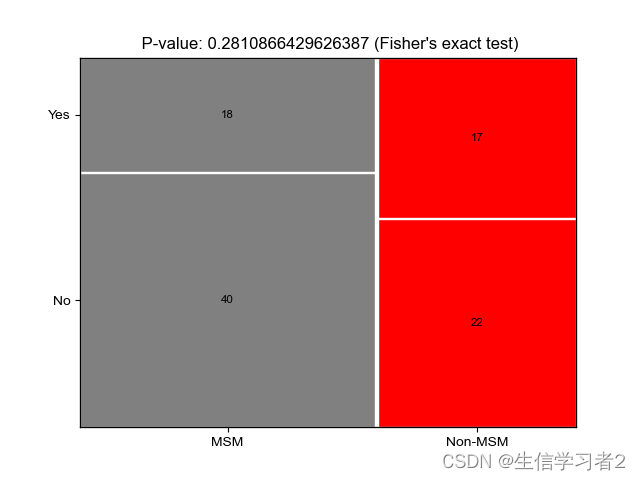
本教程是使用一个Python脚本来绘制马赛克图,用于可视化两个变量的频率分布。
数据
大家通过以下链接下载数据:
- 百度网盘链接:https://pan.baidu.com/s/1f1SyyvRfpNVO3sLYEblz1A
- 提取码: 请关注WX公zhong号_生信学习者_后台发送 复现msm 获取提取码
Python packages required
Drawing a mosaic plot using mosaic_plot.py
使用一个Python脚本mosaic_plot.py,以及一个包含MSM 和 Non-MSM个体相关的物种的表格,这些物种被识别为革兰氏阴性或非革兰氏阴性,在two_variable_mosaic.tsv: ./data/two_variable_mosaic.tsv中。
mosaic_plot.pycodes
#!/usr/bin/env python

"""
NAME: mosaic_plot.py
DESCRIPTION: mosaic_plot.py is a python script for visualizing proportions of data points along two variables.
"""


import pandas as pd
from scipy.stats import fisher_exact
import matplotlib.pyplot as plt
from statsmodels.graphics.mosaicplot import mosaic
import matplotlib
import sys
import argparse
import textwrap


def make_mosaic_plot(two_variable_file, facecolor_dict, output_fig, font_style = "sans-serif,Arial"):
    font_family, font_type = font_style.split(",")
    matplotlib.rcParams['font.family'] = font_family
    matplotlib.rcParams['font.sans-serif'] = font_type
    two_variable_df = pd.read_csv(two_variable_file, sep = "\t", index_col = False)
    features, variable1, variable2 = two_variable_df.columns
    cont_df = pd.crosstab(two_variable_df[variable1], two_variable_df[variable2])
    res = fisher_exact(cont_df, alternative = "two-sided")
    label_dict = {}
    for idx in cont_df.index.to_list():
        for col in cont_df.columns.to_list():
            label_dict[(idx, col)]  = cont_df.loc[idx, col]
    labelizer = lambda k:label_dict[k]

    variable2_0, variable2_1 = sorted(set(two_variable_df[variable2].to_list()))
    props = {}
    for variable in facecolor_dict:
        props[(variable, variable2_0)] = {"facecolor": facecolor_dict[variable], "edgecolor": "white"}
        props[(variable, variable2_1)] = {"facecolor": facecolor_dict[variable], "edgecolor": "white"}
    mosaic(two_variable_df, [variable1, variable2], labelizer = labelizer, properties = props, title = " P-value: "+ str(res[1]) + " (Fisher's exact test)")
    plt.savefig(output_fig)

if __name__ == "__main__":
    def read_args(args):
        # This function is to parse arguments

        parser = argparse.ArgumentParser(formatter_class=argparse.RawDescriptionHelpFormatter,
                                         description = textwrap.dedent('''\
                                         This program is to draw a mosaic plot.
                                         '''),
                                         epilog = textwrap.dedent('''\
                                         examples: mosaic_plot.py --input input_file.tsv --facecolor_map facecolor_mapfile.tsv --output mosaic_plot.png
                                         '''))
        parser.add_argument('--input',
                             nargs = '?',
                             help = 'Input a file containing two variable information regarding each individual subject.',
                             type = str,
                             default = None)

        parser.add_argument('--facecolor_map',
                            nargs = '?',
                            help = 'Specify the the pathway to SCFA metabolisms database. default: /vol/projects/khuang/databases/SCFA/SCFA_pathways.tsv',
                            default = '/vol/projects/khuang/databases/SCFA/SCFA_pathways.tsv')

        parser.add_argument('--font_style',
                            nargs = '?',
                            help = 'Specify the font style, font family and font type is delimited by a comma. default: [sans-serif,Arial]',
                            default = 'sans-serif,Arial')

        parser.add_argument('--output',
                            nargs = '?',
                            help = 'Specify the output figure name.',
                            type = str,
                            default = None)

        return vars(parser.parse_args())

    pars = read_args(sys.argv)
    facecolor_dict = {i.rstrip().split("\t")[0]: i.rstrip().split("\t")[1] for i in open(pars['facecolor_map']).readlines()}
    make_mosaic_plot(pars["input"], facecolor_dict , pars["output"], font_style = pars["font_style"])
- Usage:
mosaic_plot.py [-h] [--input [INPUT]] [--facecolor_map [FACECOLOR_MAP]] [--font_style [FONT_STYLE]] [--output [OUTPUT]]

This program is to draw a mosaic plot.

optional arguments:
  -h, --help            show this help message and exit
  --input [INPUT]       Input a file containing two variable information regarding each individual subject.
  --facecolor_map [FACECOLOR_MAP]
                        Specify the the pathway to SCFA metabolisms database. default: /vol/projects/khuang/databases/SCFA/SCFA_pathways.tsv
  --font_style [FONT_STYLE]
                        Specify the font style, font family and font type is delimited by a comma. default: [sans-serif,Arial]
  --output [OUTPUT]     Specify the output figure name.

examples:

python mosaic_plot.py --input input_file.tsv --facecolor_map facecolor_mapfile.tsv --output mosaic_plot.png
示例命令:
python mosaic_plot.py \
    --input two_variable_mosaic.tsv \
    --facecolor_map facecolor_map.tsv \
    --output mosaic_plot.png
Note
马赛克图的面颜色应该按照示例中的映射文件mapping file: ./data/facecolor_map.tsv来指定。


 157
157

 被折叠的 条评论
为什么被折叠?
被折叠的 条评论
为什么被折叠?
 到【灌水乐园】发言


