


在调用matplotlib绘制图形的时候经常需要变换颜色,默认颜色画出来的图显得不够高大上,这时候可通过调用matplotlib中的rcParams参数提前设定,这样就可以改变默认颜色。
一、自定义画布样式
1、直接修改rcParams参数
你可以在python脚本中动态更改默认rc(运行时配置)设置,也可以在python shell中交互更改。所有rc设置都存储在一个字典的变量中:rcParams,它是matplotlib包的全局变量。在画图前直接调用matplotlib.rcParams进行设置:
import numpy as np
import matplotlib.pyplot as plt
import matplotlib as mpl
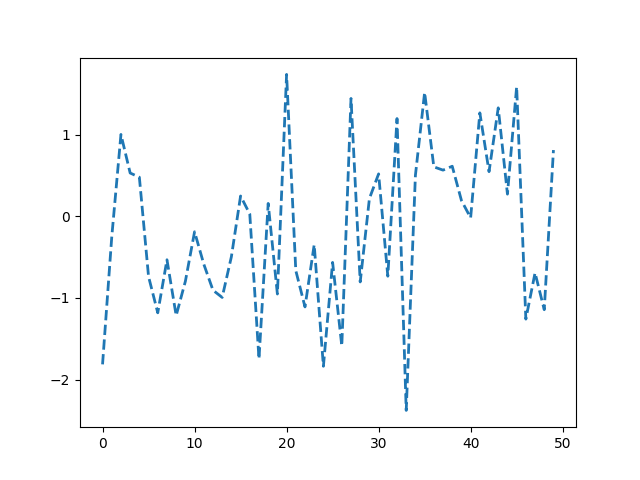
mpl.rcParams['lines.linewidth'] = 2
mpl.rcParams['lines.linestyle'] = '--'
data = np.random.randn(50)
plt.plot(data)输出图像:
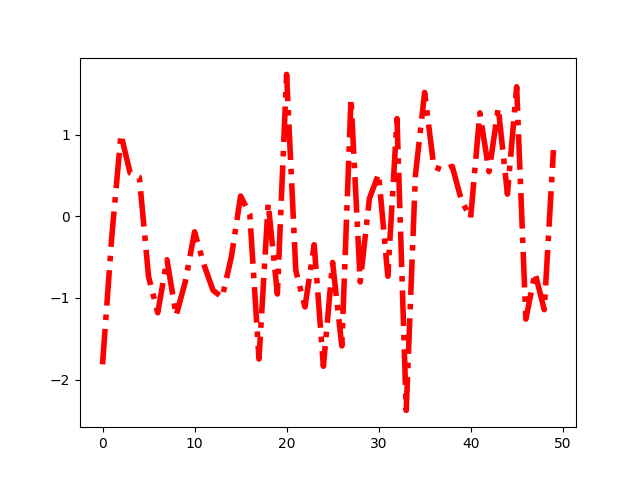
2、调用mpl.rc()函数进行修改
mpl.rc('lines', linewidth=4, linestyle='-.')
plt.plot(data)
输出图片:
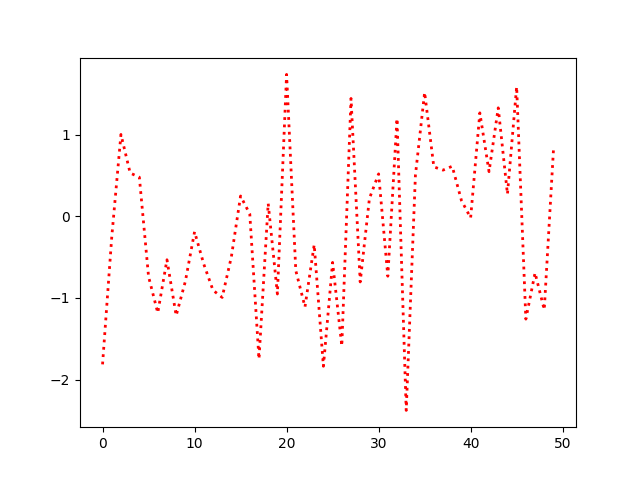
3、使用matplotlib的上下文管理器(一个函数)临时修改rcParams
with mpl.rc_context({'lines.linewidth': 2, 'lines.linestyle': ':'}):
    plt.plot(data)
输出图像:
二、使用matplotlib已经定义的样式表进行设置(推荐)
另一种改变图形视觉外观的方法是在一个样式表中设置rcParams,并使用matplotlib.style.use导入该样式表。通过这种方式,您可以通过简单地更改导入的样式表轻松地在不同的样式之间切换。matplotlibrc文件支持所有的rcParams。有关rcParams的完整列表,请参阅matplotlib.rcParams。有关在样式表中被忽略的rcParams列表,请参阅matplotlib.style.use。
Matplotlib提供了许多预定义的样式。例如,有一个预定义的样式叫做“ggplot”,它模仿了ggplot (R的一个流行的绘图包)的美感。要使用这个样式,代码:
plt.style.use('ggplot')列举出所有可用的样式表,使用代码:
print(plt.style.available)输出:
['Solarize_Light2', '_classic_test_patch', '_mpl-gallery', '_mpl-gallery-nogrid', 'bmh', 'classic', 'dark_background', 'fast', 'fivethirtyeight', 'ggplot', 'grayscale', 'seaborn', 'seaborn-bright', 'seaborn-colorblind', 'seaborn-dark', 'seaborn-dark-palette', 'seaborn-darkgrid', 'seaborn-deep', 'seaborn-muted', 'seaborn-notebook', 'seaborn-paper', 'seaborn-pastel', 'seaborn-poster', 'seaborn-talk', 'seaborn-ticks', 'seaborn-white', 'seaborn-whitegrid', 'tableau-colorblind10']


 737
737


 被折叠的 条评论
为什么被折叠?
被折叠的 条评论
为什么被折叠?
 到【灌水乐园】发言


