


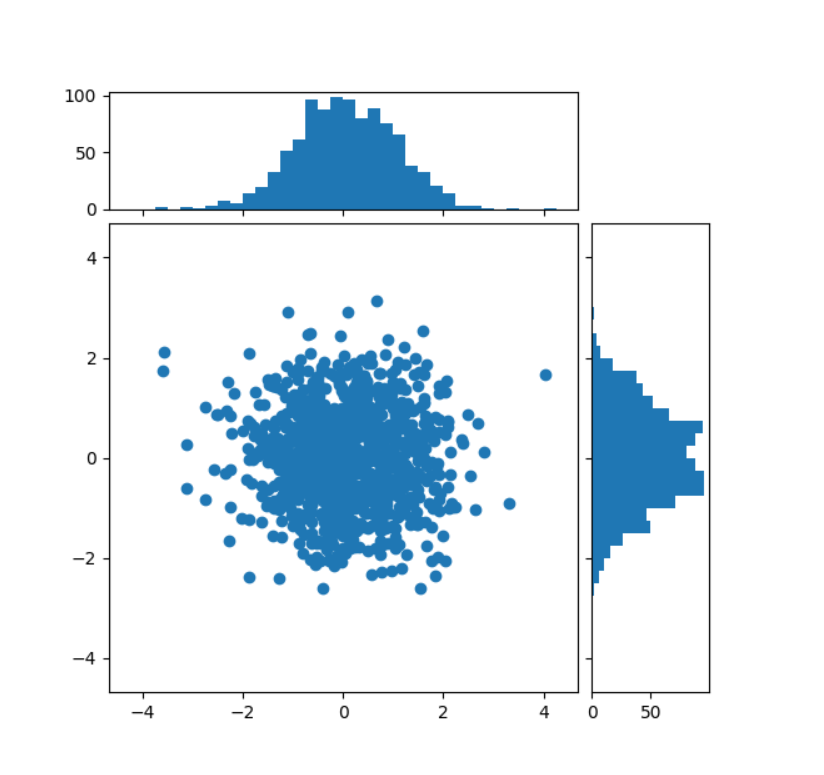
Scatter plot with histograms
说白了就是搞三个subplot
Start with a square Figure.
fig = plt.figure(figsize=(6, 6))
Add a gridspec with two rows and two columns and a ratio of 1 to 4 between
the size of the marginal axes and the main axes in both directions.
Also adjust the subplot parameters for a square plot.
gs = fig.add_gridspec(2, 2, width_ratios=(4, 1), height_ratios=(1, 4), left=0.1, right=0.9, bottom=0.1, top=0.9, wspace=0.05, hspace=0.05)
Create the Axes.
ax = fig.add_subplot(gs[1, 0]) ax_histx = fig.add_subplot(gs[0, 0], sharex=ax) ax_histy = fig.add_subplot(gs[1, 1], sharey=ax)
Draw the scatter plot and marginals.
scatter_hist(x, y, ax, ax_histx, ax_histy)


 615
615


 被折叠的 条评论
为什么被折叠?
被折叠的 条评论
为什么被折叠?
 到【灌水乐园】发言


