


Load the sample data. Create data vector x from the
first column of the data matrix, which contains sepal length measurements
from iris flowers. Create data vector y from the second
column of the data matrix, which contains sepal width measurements from the
same flowers.
load fisheriris.mat;
x = meas(:,1);
y = meas(:,2);
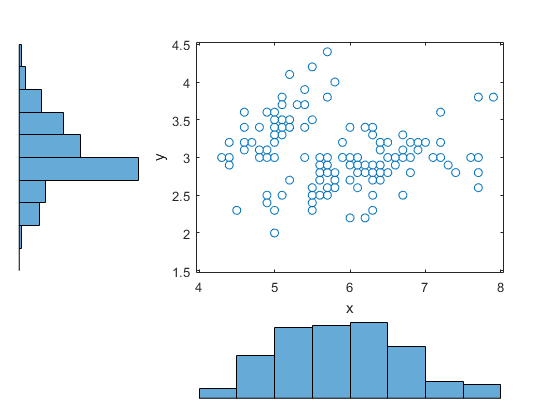
Create a scatter plot and two marginal histograms to visualize the
relationship between sepal length and sepal width.
scatterhist(x,y)
Display a data tip for a bin in a histogram. A data tip appears when you
hover over a bin in a histogram.
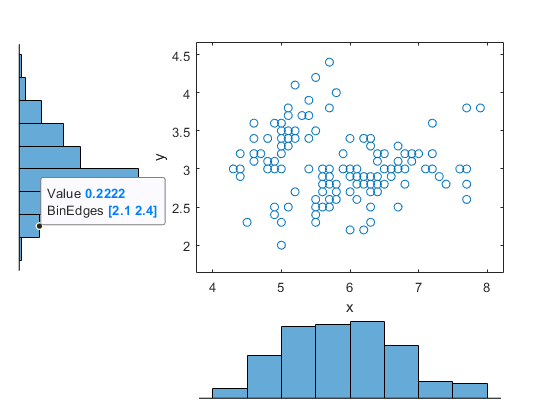
The data tip displays the probability density function
estimate of the selected bin and the lower and upper values for the bin
edges.


 901
901


 被折叠的 条评论
为什么被折叠?
被折叠的 条评论
为什么被折叠?
 到【灌水乐园】发言


