


本文主要简述如何在CST中自定义激励信号
一、理论
激励信号的函数
其中α=-15.47 f0=5.4GHz t:ns
MATLAB中绘制的信号图形:

二、实践-CST

CST里面默认采用的高斯信号,是根据我们所设定的频率范围自动设置

点击新建一个激励信号,可以发现,CST中已经自带很多设置好的信号
那么如何自定义激励信号?
可以从新建的信号中可以看到,有一个user defined
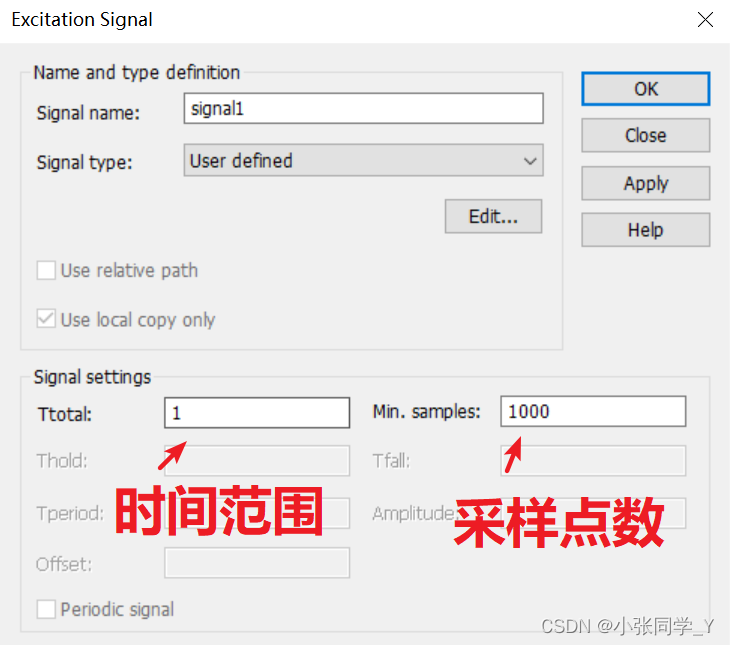
其中Ttotal表示的是信号的时间范围,Min.sample 表示的是采样点数
(此处需要与代码中的时间范围和采样点数一致)
可以点击Edit,进入到VBA编程
' userdefined excitation function

Option Explicit

Function ExcitationFunction(dtime As Double) As Double

   'Assign the excitation signal value for the given time to the function name.

   ExcitationFunction = 0.0

End Function

' -------------------------------------------------------------------------------------------------
' Main: This function serves as a main program for testing purposes. (runs and plots the function)
'       You need to rename this function to "Main" for debugging the excitation function.
'
'       Please adjust the time step width and the number of time steps accordingly.
'
'		PLEASE NOTE that a userdefined excitation file (*.usf) must not contain a main program for
'       proper execution by the framework. Therefore please ensure to rename this function
'       to e.g. "Main2" before the Transient Solver is started
' -------------------------------------------------------------------------------------------------

Sub Main2
	Dim tmax As Double, ntstep As Long

	' -------------- PLEASE ADJUST THE SETTINGS BELOW ----------------------
	tmax   = 10.0
	ntstep = 100
	' -------------- PLEASE ADJUST THE SETTINGS ABOVE ----------------------

	Dim signal As Object, n As Long, tstep As Double
	Set signal = Result1D("")
	signal.Initialize ntstep
	tstep = tmax / ntstep

	For n=0 To ntstep-1
		signal.SetXY(n, n * tstep, ExcitationFunction(n * tstep))
	Next n

	signal.Save GetProjectBaseName() + GetProjectBaseNameSeparator() + "excitation function.sig"
	signal.AddToTree "Excitation Signals\Userdefined Functions\signal1_plot"
	SelectTreeItem  "Excitation Signals\Userdefined Functions\signal1_plot"
	Resulttree.RefreshView
End Sub
默认代码,主要修改tmax和 ntstep,即总的时间范围和采样点数
可以在function 里面添加自定义的信号
' userdefined excitation function

Option Explicit

Function ExcitationFunction(dtime As Double) As Double

   'Assign the excitation signal value for the given time to the function name.

   ExcitationFunction = Exp(-15.47*(dtime-3)^2)*Cos(2*pi*5.4*(dtime-3))

End Function

' -------------------------------------------------------------------------------------------------
' Main: This function serves as a main program for testing purposes. (runs and plots the function)
'       You need to rename this function to "Main" for debugging the excitation function.
'
'       Please adjust the time step width and the number of time steps accordingly.
'
'		PLEASE NOTE that a userdefined excitation file (*.usf) must not contain a main program for
'       proper execution by the framework. Therefore please ensure to rename this function
'       to e.g. "Main2" before the Transient Solver is started
' -------------------------------------------------------------------------------------------------

Sub Main2
	Dim tmax As Double, ntstep As Long

	' -------------- PLEASE ADJUST THE SETTINGS BELOW ----------------------
	tmax   = 6.0
	ntstep = 1000
	' -------------- PLEASE ADJUST THE SETTINGS ABOVE ----------------------

	Dim signal As Object, n As Long, tstep As Double
	Set signal = Result1D("")
	signal.Initialize ntstep
	tstep = tmax / ntstep

	For n=0 To ntstep-1
		signal.SetXY(n, n * tstep, ExcitationFunction(n * tstep))
	Next n

	signal.Save GetProjectBaseName() + GetProjectBaseNameSeparator() + "excitation function.sig"
	signal.AddToTree "Excitation Signals\Userdefined Functions\signal1_plot"
	SelectTreeItem  "Excitation Signals\Userdefined Functions\signal1_plot"
	Resulttree.RefreshView
End Sub
修改后的代码,主要修改tmax和 ntstep,即总的时间范围和采样点数;
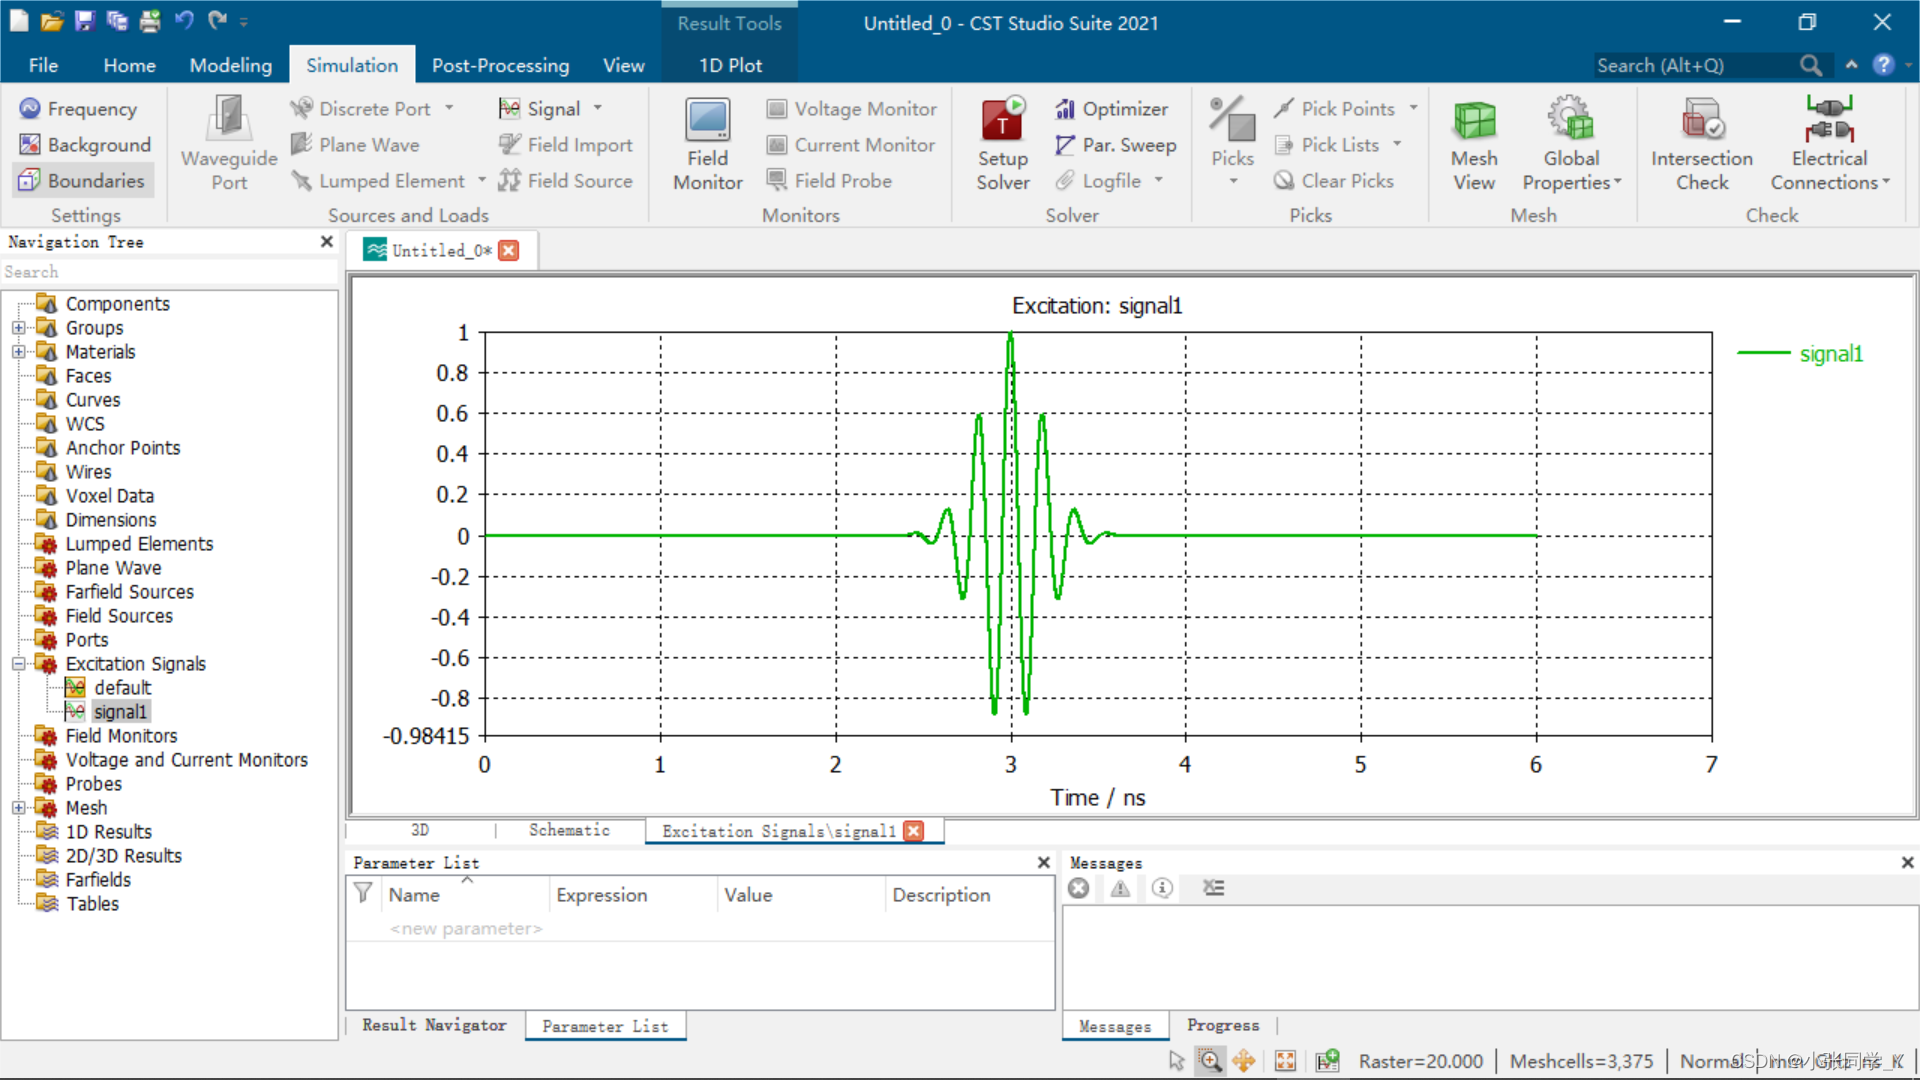
目前设置时间范围为0-6ns,采样点数1000;函数为开头所提到的。
(此处需要与选择框中的时间范围和采样点数一致)
注意变量t是用dtime来表示的
Notes:可以通过判断设置分段函数的激励信号
实际操作:
感谢观看。


 9684
9684


 被折叠的 条评论
为什么被折叠?
被折叠的 条评论
为什么被折叠?
 到【灌水乐园】发言


