


FV(Fisher Vector)
1.http://blog.csdn.net/ikerpeng/article/details/41644197
本质是对高斯分布的变量求偏导,也就是对权重,均值,标准差求偏导.
我们将一张图近似为一个高斯分布,由这个高斯分布来表示这张图像。假设我们是做目标的检测,那么当你得到一个有相同的高斯分布的图的时候你就可以判断出这就是那个目标了。但实际的情况是却不一定是这样的,我们看一张图:
这两张图上特征点的分布在黑色的区域,二者的分布却可以一样(当然我画的不是很好)!
由此,我们知道,在高斯分布的基础上我们再找到变化的方向,我们便可以更加准确的表示这一张图!
2.http://blog.csdn.net/carrierlxksuper/article/details/28151013
Fisher vector本质上是用似然函数的梯度vector来表达一幅图像,这个梯度向量的物理意义就是describes the direction in which parameters should be modified to best fit the data,说白了就是数据拟合中对参数调优的过程。似然函数是哪里来的呢?这里就涉及到上面所说的生成方法了。对于一幅图像 ,有T个描述子(比如SIFT),那么这幅图像就可以表示为:
如果假设这些特征xt符合一定的分布并且这些分布彼此独立,也就是i.i.d(独立同分布)。于是就有:
取对数之后变成
现在需要一组N个高斯分布的线性组合来逼近这些i.i.d.,假设这些高斯混合分布参数也是 λ ,于是
公式(2)中的 pi(xt|λ) 就是高斯分布,
有了公式(1),(2),(3)之后,就可以对公式(1)求导,然后将偏导数,也就是梯度作为fisher vector了。
HOG(Histogram of Oriented Gradients)
focuses on static appearance information
1.图像灰度化
2.划分成小cell(2x2)
3.计算每个 cell中每个pixel的gradient(即orientation)
4.统计每个cell中的梯度直方图(不同梯度的个数)即可形成每个cell的descriptor
5.将每n个cell组成一个block(如3x3cell/block),一个block中所有cell的特征descriptor串联起来便可以得到这个block的HOG特征descriptor.
6.将所有block的descriptor串联起来便可以得到整张图的…
HOG(Histogram of Optical Flow)
capture the local motion information
MBH(Motion Boundry Histogram)
[derivatives of optical flows]
在存在背景运动时,MBH能捕捉到相对运动,
The MBH descriptor separates the optical flow field
Iw=(Ix,Iy)
into its
x
and
Since MBH represents the gradient of the optical flow, constant motion information is suppressed and only information about changes in the flow field (i.e., motion boundaries) is kept.
It is a simple way to eliminate noise due to background motion.
Dense Trajectory
[Action Recognition by Dense Trajectories, cvpr2011]
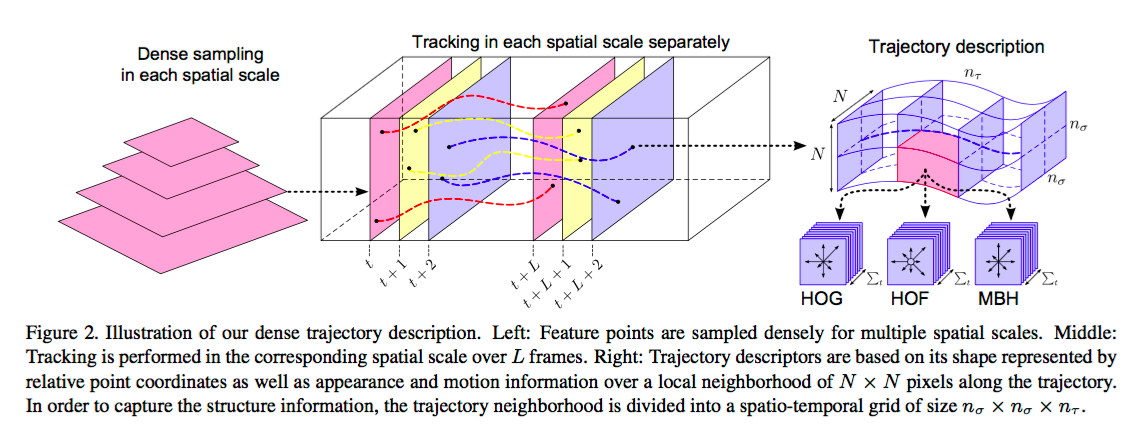
densely sample feature points in each frame
track points in the video based on optical flow.
compute multiple descriptors along the trajectories(the length of a trajectory is
L
frames) of feature points to capture shape, appearance and motion information.
IDT(Improved Dense Trajectory)
- Explicit camera motion estimation
· Assumption: two consecutive frames are related by a homography.
· Match feature points between frames using SURF descriptors and dense optical flow - Removing inconsistent matches due to humans: use a human detector to remove matches from human regions (computation expensive)
bag of features
http://yongyuan.name/blog/bag-of-word-model.html
1.feature extraction
有
2.codebook
这些features经过了kmeans聚类后,得到了k个聚类中心(在BOW模型中聚类中心我们称它们为视觉词),码本的长度也就为k
3.生成每张图的histogram(according to codebook)
计算每一幅图像的每一个feature到这k个中心的距离,并将其映射到距离最近的视觉词中(即将该视觉词的对应词频+1)。完成这一步后,每一幅图像就变成了一个与视觉词序列相对应的词频矢量。
4.train
5.新的图先经过3后,再用4的分类器进行分类
TIP
have significent local variations in both spatial and temporal domain
Spatial Pyramid Matching
SPM出现的背景是bag of visual words模型被大量地用在了Image representation中,但是BOW模型完全缺失了特征点的spatial信息。
文章的贡献,看完以后觉得其实挺简单的,和分块直方图其实是一个道理——将图像分成若干块(sub-regions),分别统计每一子块的特征,最后将所有块的特征拼接起来,形成完整的特征。这就是SPM中的Spatial。在分块的细节上,作者采用了一种多尺度的分块方法,即分块的粒度越大越细(increasingly fine),呈现出一种层次金字塔的结构,这就是SPM中的Pyramid。(http://www.cnblogs.com/yymn/p/4589327.html)
X 和Y 是d维特征空间上的两个集合。(图像的特征空间
d=2
)
More specifically, let us construct a sequence of grids at resolutions
0,...,L
, such that the grid at level
l
has
Let
HlX
and
HlY
denote the histograms of
X
and
Note that the number of matches found at level l also includes all the matches found at the finer level
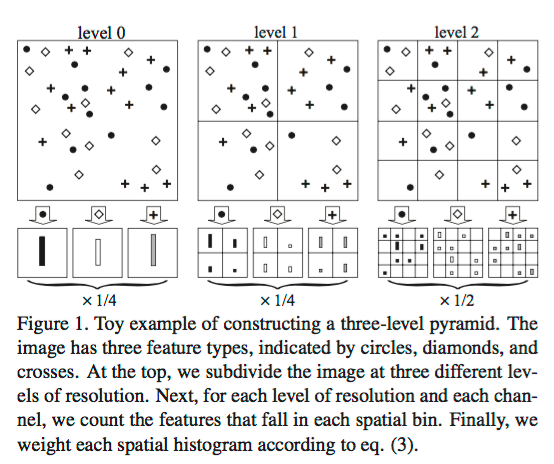
Specifically, we quantize all feature vectors into M discrete types(图中有
Each channel m gives us two sets of two-dimensional vectors,
This approach has the advantage of maintaining continuity with the popular “visual vocabulary” paradigm — in fact, it reduces to a standard bag of features when L=0 .
we can implement KL as a single histogram intersection of “long” vectors formed by concatenating the appropriately weighted histograms of all channels at all resolutions.
For L levels and
//to be continued


 233
233

 被折叠的 条评论
为什么被折叠?
被折叠的 条评论
为什么被折叠?
 到【灌水乐园】发言


