


使用plot绘制图形函数,设置其中的图形参数,包含线条颜色,粗细,线条类型。
x=1:15;
y=x.^3;
方法一
是在plot中直接加入图形的参数属性,如下
设置图形线条颜色
h=plot(x,y,'r');或者
h=plot(x,y,'color','red'); 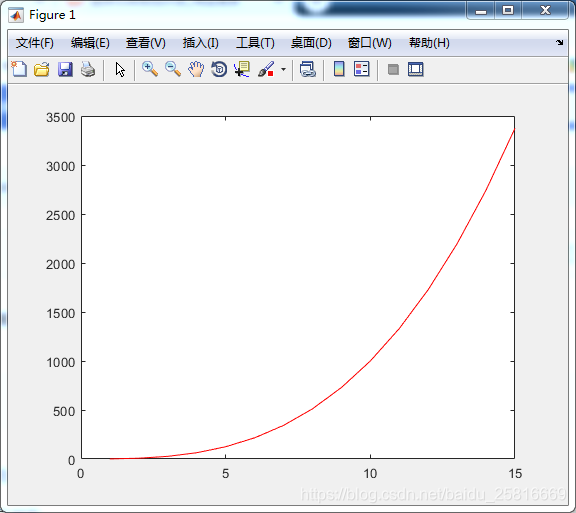
设置图形线条类型
h=plot(x,y,'--r');
方法二
定义h结构体中属性参数
h=plot(x,y);
h.Color='red';
h.LineWidth=1;
h.LineStyle='--';
h.Selected = 'on';
另外可以通过get(h)获取h中的相关参数的定义,得到如下参数
AlignVertexCenters: 'off'
            Annotation: [1×1 matlab.graphics.eventdata.Annotation]
          BeingDeleted: 'off'
            BusyAction: 'queue'
         ButtonDownFcn: ''
              Children: [0×0 GraphicsPlaceholder]
              Clipping: 'on'
                 Color: [0 0.4470 0.7410]
             CreateFcn: ''
             DeleteFcn: ''
           DisplayName: ''
      HandleVisibility: 'on'
               HitTest: 'on'
         Interruptible: 'on'
              LineJoin: 'round'
             LineStyle: '--'
             LineWidth: 0.5000
                Marker: 'none'
       MarkerEdgeColor: 'auto'
       MarkerFaceColor: 'none'
         MarkerIndices: [1 2 3 4 5 6 7 8 9 10 11 12 13 14 15]
            MarkerSize: 6
                Parent: [1×1 Axes]
         PickableParts: 'visible'
              Selected: 'off'
    SelectionHighlight: 'on'
                   Tag: ''
                  Type: 'line'
         UIContextMenu: [0×0 GraphicsPlaceholder]
              UserData: []
               Visible: 'on'
                 XData: [1 2 3 4 5 6 7 8 9 10 11 12 13 14 15]
             XDataMode: 'manual'
           XDataSource: ''
                 YData: [1 8 27 64 125 216 343 512 729 1000 1331 1728 2197 2744 3375]
           YDataSource: ''


 1039
1039


 被折叠的 条评论
为什么被折叠?
被折叠的 条评论
为什么被折叠?
 到【灌水乐园】发言


