


mAP: mean Average Precision, 是多标签图像分类任务中的评价指标。
AP衡量的是学出来的模型在给定类别上的好坏,而mAP衡量的是学出的模型在所有类别上的好坏。
参考添加链接描述,写的很好
一 首先关注 TP\FP\FN\TN
TP、FP、FN、TNTrue Positive (TP):

----正确地判定为正类
False Positive (FP): IoU<=阈值 的检测框数量,或者是检测到同一个 GT 的多余检测框的数量 -------错误地判定为正类
False Negative (FN): 没有检测到的 GT 的数量 ----错误地判定为负类
True Negative (TN): 在 mAP 评价指标中不会使用到 ------正确地判定为负类。
由此引出Recall、Precision
二 Recall、Precision
查准率、查全率
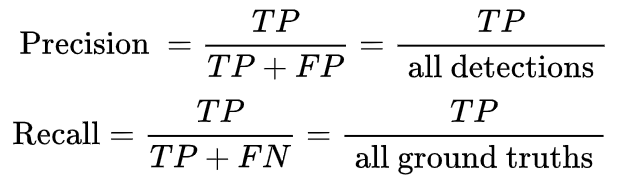
查准率(Precision): TP/(TP + FP) 正确预测为正的数目 / 所有预测正确的数目
查全率(Recall): TP/(TP + FN)------ 正确预测正的数目/正的数目

AP 是计算某一类 P-R 曲线下的面积,mAP 则是计算所有类别 P-R 曲线下面积的平均值。
举例:
假设我们有 7 张图片(Images1-Image7),这些图片有 **15 个目标(绿色的框,GT 的数量,上文提及的 all ground truths)**以及 24 个预测边框(红色的框,A-Y 编号表示,并且有一个置信度值)

列出以下表格,其中 Images 代表图片的编号,Detections 代表预测边框的编号,Confidences 代表预测边框的置信度,TP or FP 代表预测的边框是标记为 TP 还是 FP(认为预测边框与 GT 的 IOU 值大于等于 0.3 就标记为 TP;若一个 GT 有多个预测边框,则认为 IOU 最大且大于等于 0.3 的预测框标记为 TP,其他的标记为 FP,即一个 GT 只能有一个预测框标记为 TP),这里的 0.3 是随机取的一个值。

绘制出 P-R 曲线(因为 AP 就是 P-R 曲线下面的面积),但是在此之前我们需要计算出 P-R 曲线上各个点的坐标,根据置信度从大到小排序所有的预测框,然后就可以计算 Precision 和 Recall 的值。

算AP是某个类别的PR曲线,MAP是所有类别。
!!!!!!!!!!!!!!!!!!!!!!!!!!!!!!!!!!!!!!!!!!!!!!!!!!!!!
包含了累加的概念(分母上的TP+FP是累加的,TP/FP也是累加的)
标号为 1 的 Precision 和 Recall 的计算方式:Precision=TP/(TP+FP)=1/(1+0)=1,Recall=TP/(TP+FN)=TP/(all ground truths)=1/15=0.0666 (all ground truths 上面有定义过了)
标号 2:Precision=TP/(TP+FP)=1/(1+1)=0.5,Recall=TP/(TP+FN)=TP/(all ground truths)=1/15=0.0666
标号 3:Precision=TP/(TP+FP)=2/(2+1)=0.6666,Recall=TP/(TP+FN)=TP/(all ground truths)=2/15=0.1333
如果只有TP没有FP的话,那么precision都是1,那么最终的AP就是1了。
如下:所以recall是越来愈大的,因为(TP+FN是不变的总数), 分子递增

计算 AP(P-R 曲线下的面积),要计算 P-R 下方的面积,一般使用的是插值的方法,取 11 个点 [0, 0.1, 0.2, 0.3, 0.4, 0.5, 0.6, 0.7, 0.8, 0.9, 1] 的插值所得


%% step1 统计出groundTruth框的个数M(计算召回率的分母)和检测框个数N
%% step2 初始化中间存储矩阵
%% Step3 遍历每张图像,每个检测框与groundTruth计算IOU
%% Step4 预测分数进行从大到小进行排序
%% Step5 计算每个检测框的召回率和精确率
%% Step6 计算当前类别的AP
%% Step7 下一个类别循环
function [averagePrecision,precision,recall] = getAP(detectionResults,groundTruthData,throushold_IOU)
% 实现评估目标检测算法的AP计算

% 输入:detectionResults table类型,同evaluateDetectionPrecision函数的输入用法
%       groundTruthData table类型,同evaluateDetectionPrecision函数的输入用法
%      throushold_IOU double类型,同evaluateDetectionPrecision函数的输入用法
% 输出:同evaluateDetectionPrecision函数的输出用法
%
% author:cuixingxing 2020.2.19
% email:cuixingxing150@gmail.com
%

predictbBoxName = detectionResults.Properties.VariableNames{1}; % 获取用户自定义的检测框的名字,detectionResults必须是3列的table
predictscoreName = detectionResults.Properties.VariableNames{2};% 获取用户自定义的分数的名字
predictlName = detectionResults.Properties.VariableNames{3};% 获取用户自定义的检测标签的名字
% 初始化输出
averagePrecision = zeros(width(groundTruthData),1);
precision = cell(width(groundTruthData),1);
recall = cell(width(groundTruthData),1);

for i = 1:width(groundTruthData)
    %% step1 统计出groundTruth框的个数M(计算召回率的分母)和检测框个数N
    currentCategorcial = groundTruthData.Properties.VariableNames{i};
    M = sum(cellfun(@(x)size(x,1),groundTruthData.(currentCategorcial)));% groundTruth个数
    indexDetectionCell = cellfun(@(x)ismember(x,currentCategorcial),detectionResults.(predictlName),'UniformOutput',false);
    N = sum(cellfun(@(x)sum(x),indexDetectionCell)); % 检测框的个数,其中内层sum针对单张图像的某个类别检测数量求和,外层是对所有图像求和

    %% step2 初始化中间存储矩阵
    P = zeros(N,2);
    Q = zeros(N,2);

    %% Step3 遍历每张图像,每个检测框与groundTruth计算IOU
    num = 1; % 用于记录检测框的数量
    for j = 1:height(detectionResults) %每幅图像
        currentDetectionArray = detectionResults.(predictbBoxName){j}(indexDetectionCell{j},:);
        currentScoresArray = detectionResults.(predictscoreName){j}(indexDetectionCell{j},:);

        groundTruthROIArray = groundTruthData.(currentCategorcial){j};
        for k = 1:size(currentDetectionArray,1) % 每个检测框
            overlapRatio = bboxOverlapRatio(currentDetectionArray(k,:),groundTruthROIArray);
            P(num,1 ) = currentScoresArray(k,1);
            if any(overlapRatio>throushold_IOU)
                P(num,2) = 1;
            else
                P(num,2) = 0;
            end
            num = num+1;
        end
    end

    %% Step4 预测分数进行从大到小进行排序
    [~,idx] = sort(P(:,1),1,"descend");
    P = P(idx,:);

    %% Step5 计算每个检测框的召回率和精确率
    currentRecall = cumsum(P(:,2)/M);
    currentPrecision = cumsum(P(:,2))./(cumsum(P(:,2))+cumsum(~P(:,2)));
    Q = [currentRecall,currentPrecision];

    %% Step6 计算当前类别的AP
    qInterp = 0:0.1:1; %11点插值法
    numsq = length(qInterp);
    qInterpPrecision = zeros(numsq,1);
    for q_idx = 1:numsq
        indexR = Q(:,1)+eps>=qInterp(q_idx);
        precisionAll = Q(:,2);
        if all(indexR==0)
            qInterpPrecision(q_idx) = 0;
        else
            qInterpPrecision(q_idx) = max(precisionAll(indexR));
        end
    end
    averagePrecision(i) = mean(qInterpPrecision);
    precision{i} = Q(:,2);
    recall{i} = Q(:,1);

    %% 画图(可选)
    isShow = true;
    if isShow
        figure;hold on;
        scatter(qInterp,qInterpPrecision,40,'r','filled');
        plot(recall{1},precision{1},'-bo');
        title(['PR curve,AP:',num2str(averagePrecision(i))]);xlabel('recall');ylabel('precision');grid on;
        legend({'11点插值',currentCategorcial})
    end
    %% Step7 下一个类别循环
end
end


 2万+
2万+


 被折叠的 条评论
为什么被折叠?
被折叠的 条评论
为什么被折叠?
 到【灌水乐园】发言


