


 本文详细介绍了Python数据可视化库Matplotlib中用于添加图例的legend函数,包括其不同调用方式、参数及其作用,如loc、bbox_to_anchor、ncols、fontsize、labelcolor等,帮助理解如何自定义图例的位置、样式和内容。
Matplotlib–legend函数
1. 函数功能
在绘图区放置图例
2. 函数调用方式
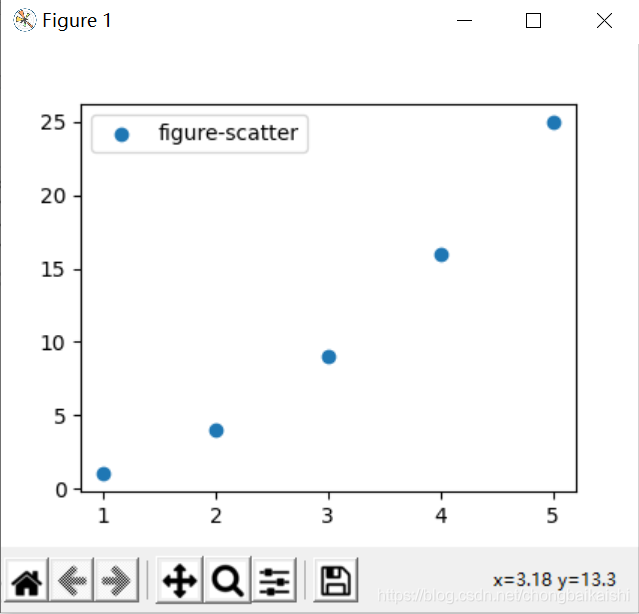
2.1 不传入参数:legend()
自动检测图例中显示的元素。在这种情况下,标签从artist中获取。在artist对象创建时指定或者通过artist对象的set_label()方法指定。
import matplotlib.pyplot as plt
import numpy as np

x = [1,2,3,4,5]
y = np.power(x,2)

plt.scatter(x,y,label='figure-scatter')
plt.legend()

plt.show()
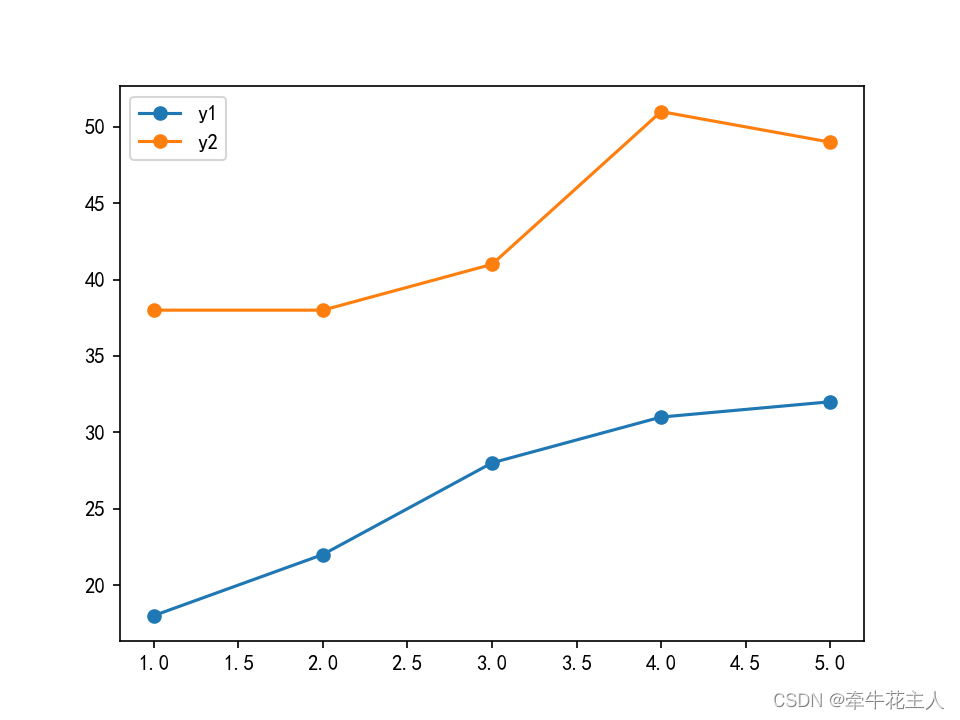
2.2 对已有对象标记图例: legend(labels)
为已经存在的线添加图例,只需要为每个对象添加一个标签,此种方式不推荐使用,因为对象和标签之间的对应关系很容易混淆。
import numpy as np
import matplotlib as mpl
import matplotlib.pyplot as plt

mpl.rcParams['font.sans-serif'] = ['KaiTi']
mpl.rcParams['axes.unicode_minus'] = False

x = np.arange(5, 0, -1)
y1 = np.array([32, 31, 28, 22, 18])
y2 = np.array([49, 51, 41, 38, 38])

plt.plot(x,y1,marker='o')
plt.plot(x,y2,marker='o')
plt.legend(['y1','y2'])

plt.show()
2.3 传入一一对象的artist对象与标签:legend(handles, labels)
import matplotlib.pyplot as plt
import numpy as np

x = np.arange(0,2.1,0.1)
y1 = np.power(x,3)
y2 = np.power(x,2)
y3 = np.power(x,1)


# 此处的line后面必须加,才能正常输出图例内容,否则显示空白图例框(不明白原因)
line1, = plt.plot(x,y1,ls=':')
line2, = plt.plot(x,y2,ls='--')
line3, = plt.plot(x,y3,ls='-')

plt.legend([line1,line2,line3],['y=x^3','y=x^2','y=x'],loc='upper left')

plt.show()

3. 函数参数
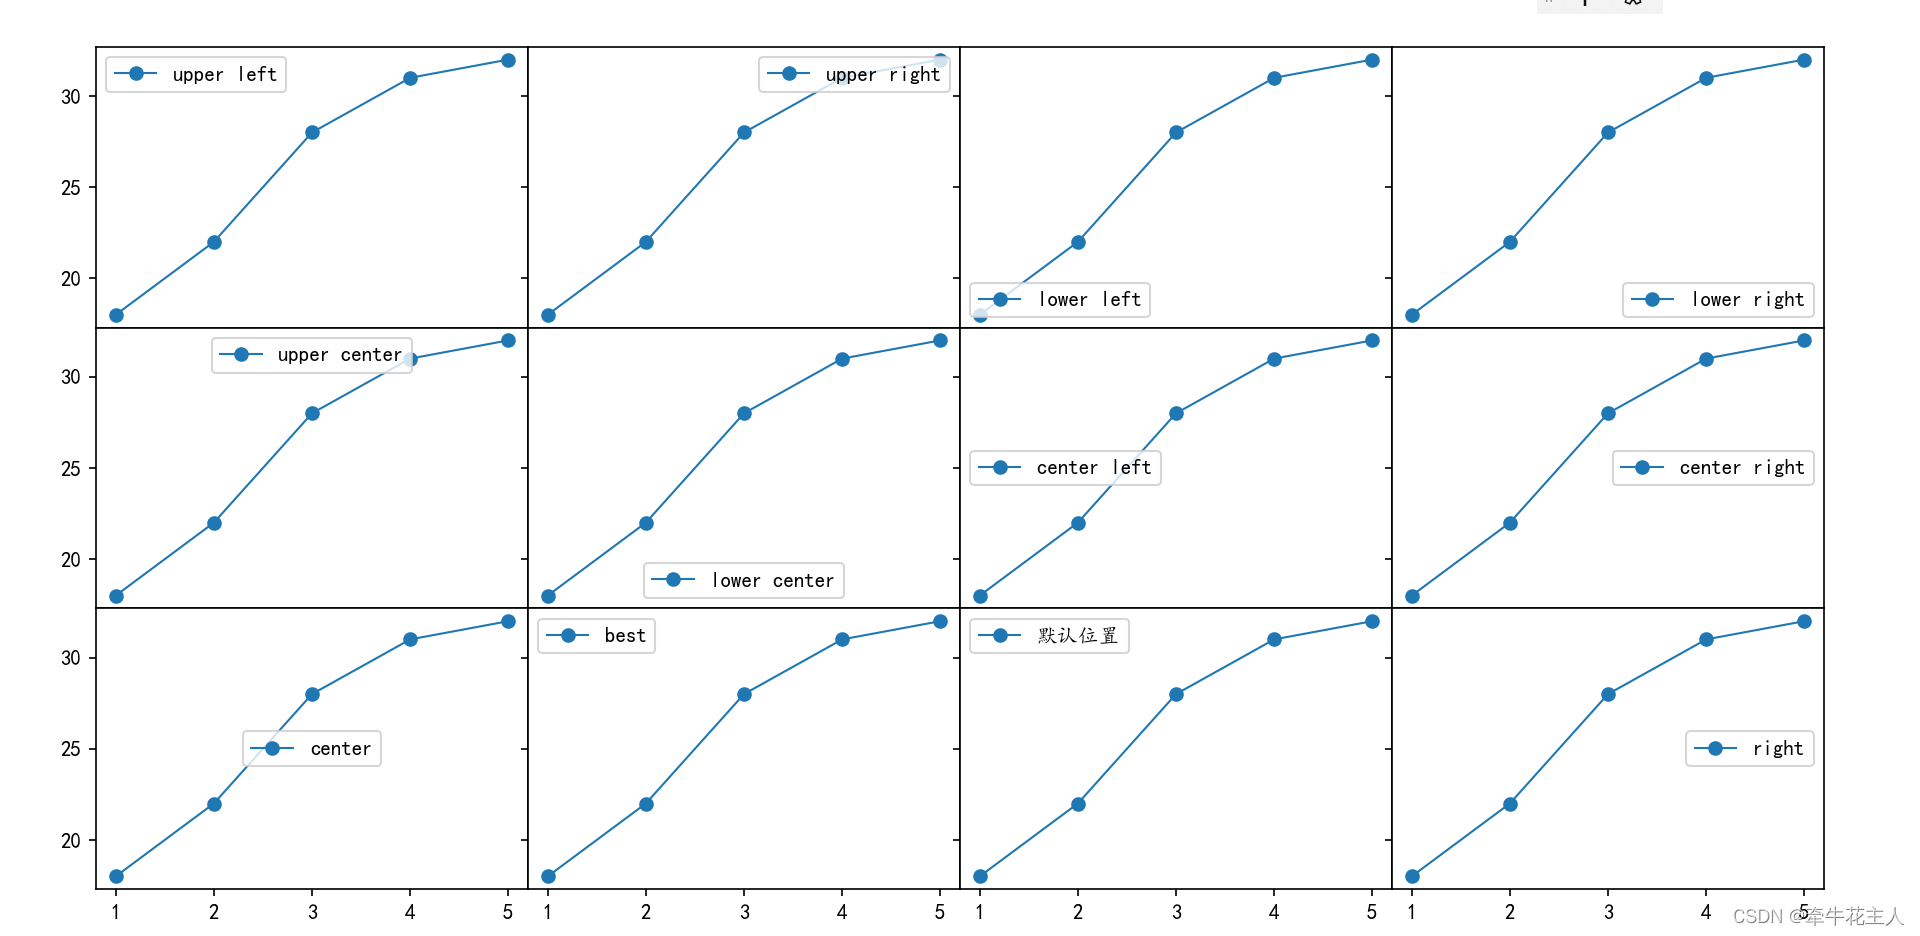
3.1 参数: loc
3.1.1 loc取值为字符串
| 参数 | 含义 |
|---|---|
| loc | 字符串或反应相对位置的浮点型数据组成的坐标数据;字符串的取值有多种,具体取值与展示效果如下所示 |
为了实现对以前版本的兼容性,‘center right’也可以使用参数’right’。除了使用字符串,还可以使用数字代替对应的字符串。
| Location String | Location Code | 位置 |
|---|---|---|
| ‘best’ | 0 | 合适位置 |
| ‘upper right’ | 1 | 右上角 |
| ‘upper left’ | 2 | 左上角 |
| ‘lower left’ | 3 | 左下角 |
| ‘lower right’ | 4 | 右下角 |
| ‘right’ | 5 | 右边 |
| ‘center left’ | 6 | 左中 |
| ‘center right’ | 7 | 右中 |
| ‘lower center’ | 8 | 下中 |
| ‘upper center’ | 9 | 下中 |
| ‘center’ | 10 | 中心 |
import numpy as np
import matplotlib as mpl
import matplotlib.pyplot as plt

mpl.rcParams['font.sans-serif'] = ['KaiTi']
mpl.rcParams['axes.unicode_minus'] = False

x = np.arange(5, 0, -1)
y1 = np.array([32, 31, 28, 22, 18])

fig,ax = plt.subplots(3,4,sharex=True,sharey=True)
plt.subplots_adjust(left=0.05,right=0.95,top=0.95,bottom=0.05,
                    wspace=0,hspace=0)
ax[0,0].plot(x,y1,marker='o',lw=1,label='upper left')
ax[0,0].legend(loc='upper left')

ax[0,1].plot(x,y1,marker='o',lw=1,label='upper right')
ax[0,1].legend(loc='upper right')

ax[0,2].plot(x,y1,marker='o',lw=1,label='lower left')
ax[0,2].legend(loc='lower left')

ax[0,3].plot(x,y1,marker='o',lw=1,label='lower right')
ax[0,3].legend(loc='lower right')

ax[1,0].plot(x,y1,marker='o',lw=1,label='upper center')
ax[1,0].legend(loc='upper center')

ax[1,1].plot(x,y1,marker='o',lw=1,label='lower center')
ax[1,1].legend(loc='lower center')

ax[1,2].plot(x,y1,marker='o',lw=1,label='center left')
ax[1,2].legend(loc='center left')

ax[1,3].plot(x,y1,marker='o',lw=1,label='center right')
ax[1,3].legend(loc='center right')

ax[2,0].plot(x,y1,marker='o',lw=1,label='center')
ax[2,0].legend(loc='center')

ax[2,1].plot(x,y1,marker='o',lw=1,label='best')
ax[2,1].legend(loc='best')

ax[2,2].plot(x,y1,marker='o',lw=1,label='默认位置')
ax[2,2].legend()

ax[2,3].plot(x,y1,marker='o',lw=1,label='right')
ax[2,3].legend(loc='right')


plt.show()
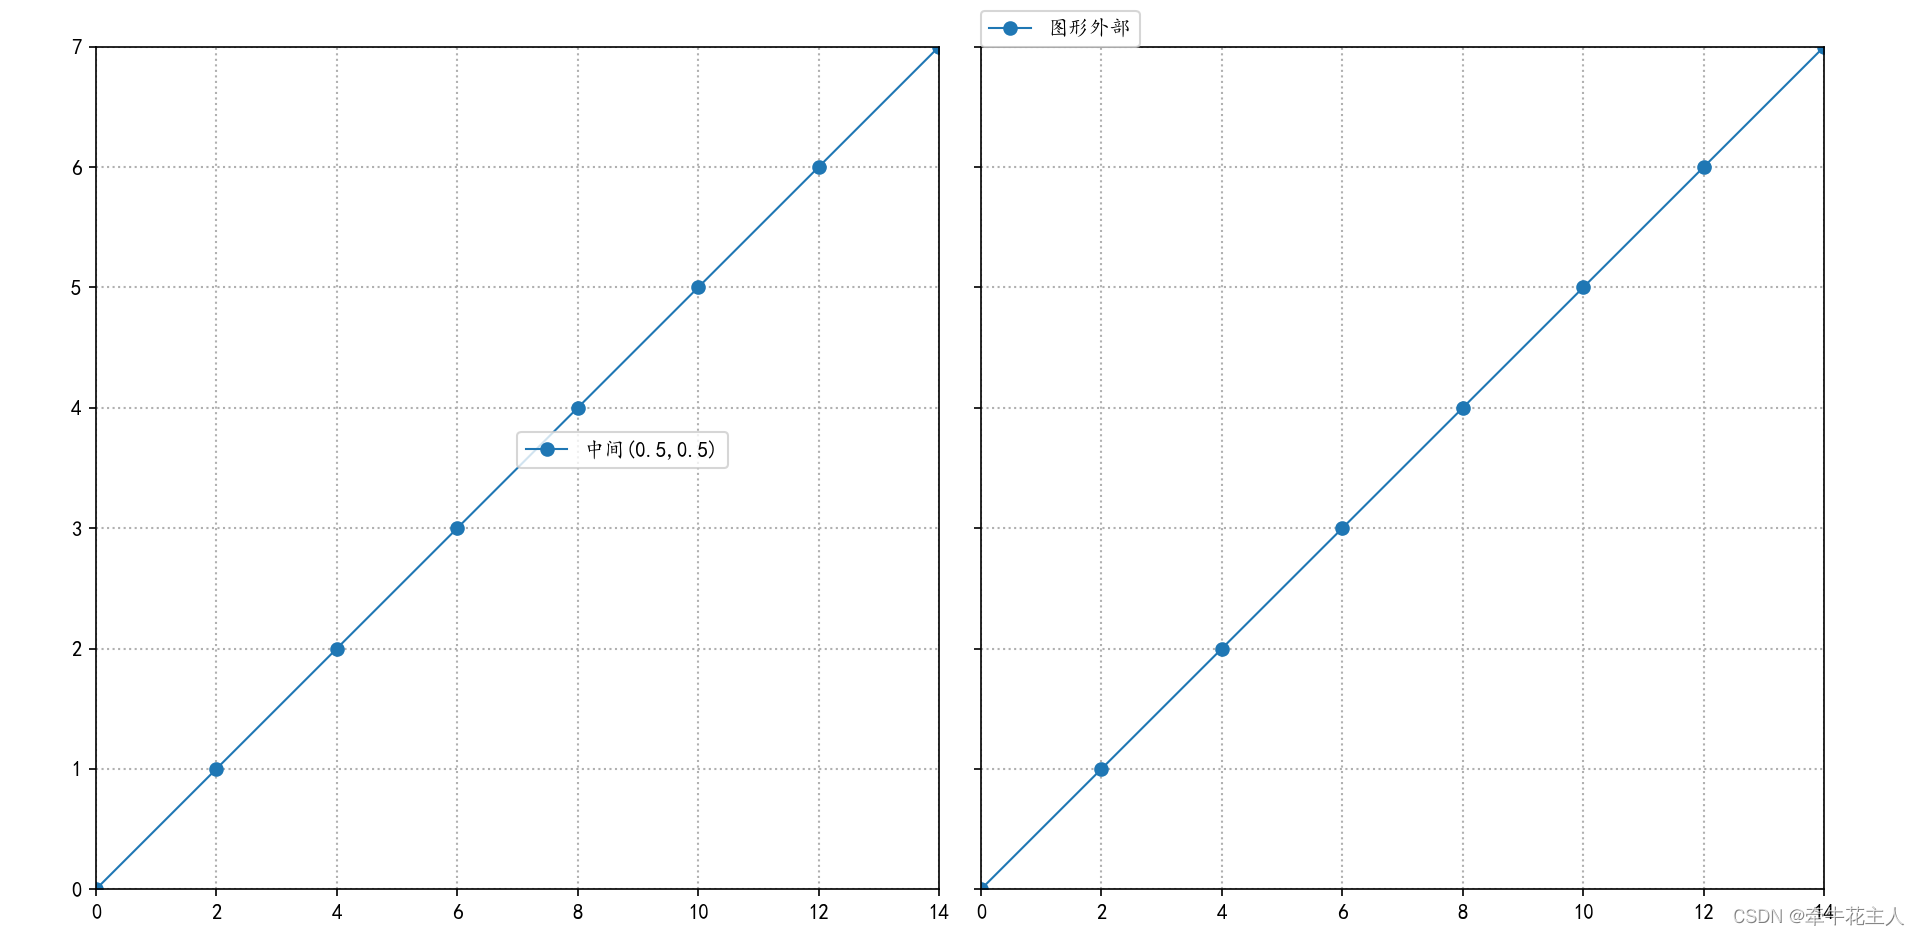
3.1.2 loc取值为坐标元组
当固定字符串的位置,无法满足要求,可以通过loc指定图例位置,此时的坐标位置为绘图区域x轴与y轴数值范围的比例,图例的左下角将放在此坐标位置。通过此参数可以实现在绘图区域内部与外部的图例展示。
图例的位置为二元数组,数组loc=(0,25,0.5),则图例左下角放置在横轴
0.25
∗
2
=
0.5
0.25*2=0.5
0.25∗2=0.5,纵轴
0.5
∗
8
=
4
0.5*8=4
0.5∗8=4即
(
0.5
,
4
)
(0.5,4)
(0.5,4)的位置。
import numpy as np
import matplotlib as mpl
import matplotlib.pyplot as plt

mpl.rcParams['font.sans-serif'] = ['KaiTi']
mpl.rcParams['axes.unicode_minus'] = False

x = np.arange(0, 16, 2)
y1 = np.arange(0, 8)

fig, ax = plt.subplots(1, 2, sharex=True, sharey=True)
plt.subplots_adjust(left=0.05, right=0.95, top=0.95, bottom=0.05,
                    wspace=0.05, hspace=0)
ax[0].plot(x, y1, marker='o', lw=1, label='中间(0.5,0.5)')
ax[0].legend(loc=(0.5, 0.5))
ax[0].grid(ls=':', lw=1)
ax[0].set_ylim(0, 7)
ax[0].set_xlim(0, 14)

ax[1].plot(x, y1, marker='o', lw=1, label='图形外部')
ax[1].legend(loc=(0, 1))
ax[1].grid(ls=':', lw=1)

plt.show()
3.2 参数:bbox_to_anchor
此参数与loc参数一起完成对图例的定位,图例参考区域当调用axes.legend()时为绘图区域,当调用figure.legend()时为画布区域,当bbox_to_anchor为4个浮点数组成的元组时,图例的参考区域为bbox_to_anchor确定的数据区域。
3.2.1 bbox_to_anchor为两个浮点数组成的元组
| 参数 | 含义 |
|---|---|
| loc | 字符串或反应相对位置的浮点型数据组成的坐标数据; |
| bbox_to_anchor | 两个或四个浮点数的元组,与loc参数一起决定图例的展示位置,具体如下: |
此时将loc与bbox_to_anchor同时使用,表明将图例的loc位置放置在bbox_to_anchor确定的坐标点上
如:
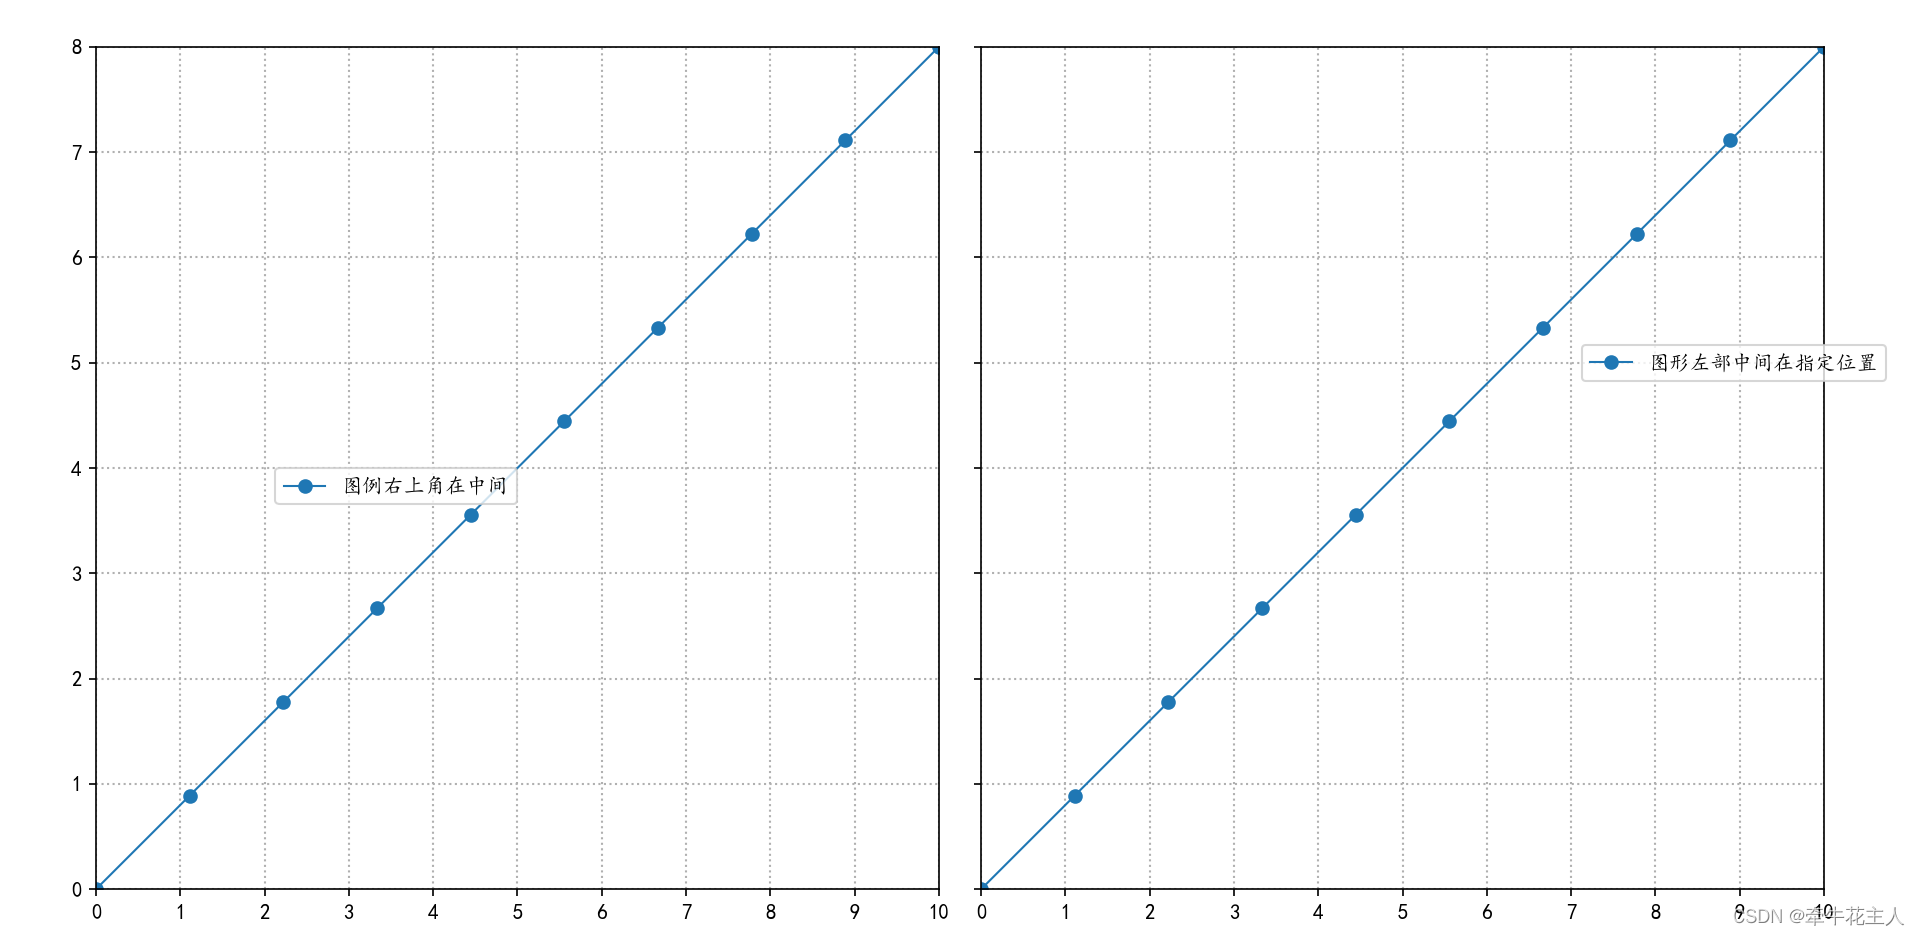
loc=‘center’, bbox_to_anchor=(0.5,0.5),表示图例的中心位置在坐标系的中间位置,即图例的中心在 2 ∗ 0.5 = 1 , 8 ∗ 0.5 = 4 ; ( 1 , 4 ) 2*0.5=1,8*0.5=4;(1,4) 2∗0.5=1,8∗0.5=4;(1,4)的位置
import numpy as np
import matplotlib as mpl
import matplotlib.pyplot as plt

mpl.rcParams['font.sans-serif'] = ['KaiTi']
mpl.rcParams['axes.unicode_minus'] = False

x = np.linspace(0, 10, 10)
y1 = np.linspace(0, 8, 10)

fig, ax = plt.subplots(1, 2, sharex=True, sharey=True)
plt.subplots_adjust(left=0.05, right=0.95, top=0.95, bottom=0.05,
                    wspace=0.05, hspace=0)
ax[0].plot(x, y1, marker='o', lw=1, label='图例右上角在中间')
ax[0].legend(loc='upper right',bbox_to_anchor=(0.5,0.5),
             borderaxespad=0)
ax[0].grid(ls=':', lw=1)
ax[0].set_ylim(0, 8)
ax[0].set_xlim(0, 10)
ax[0].set_xticks(ticks=np.arange(0,11))


ax[1].plot(x, y1, marker='o', lw=1, label='图形左部中间在指定位置')
ax[1].legend(loc='center left',bbox_to_anchor=(7/10,5/8))
ax[1].grid(ls=':', lw=1)

plt.show()
3.2.2 bbox_to_anhor为四个浮点数组成的元组
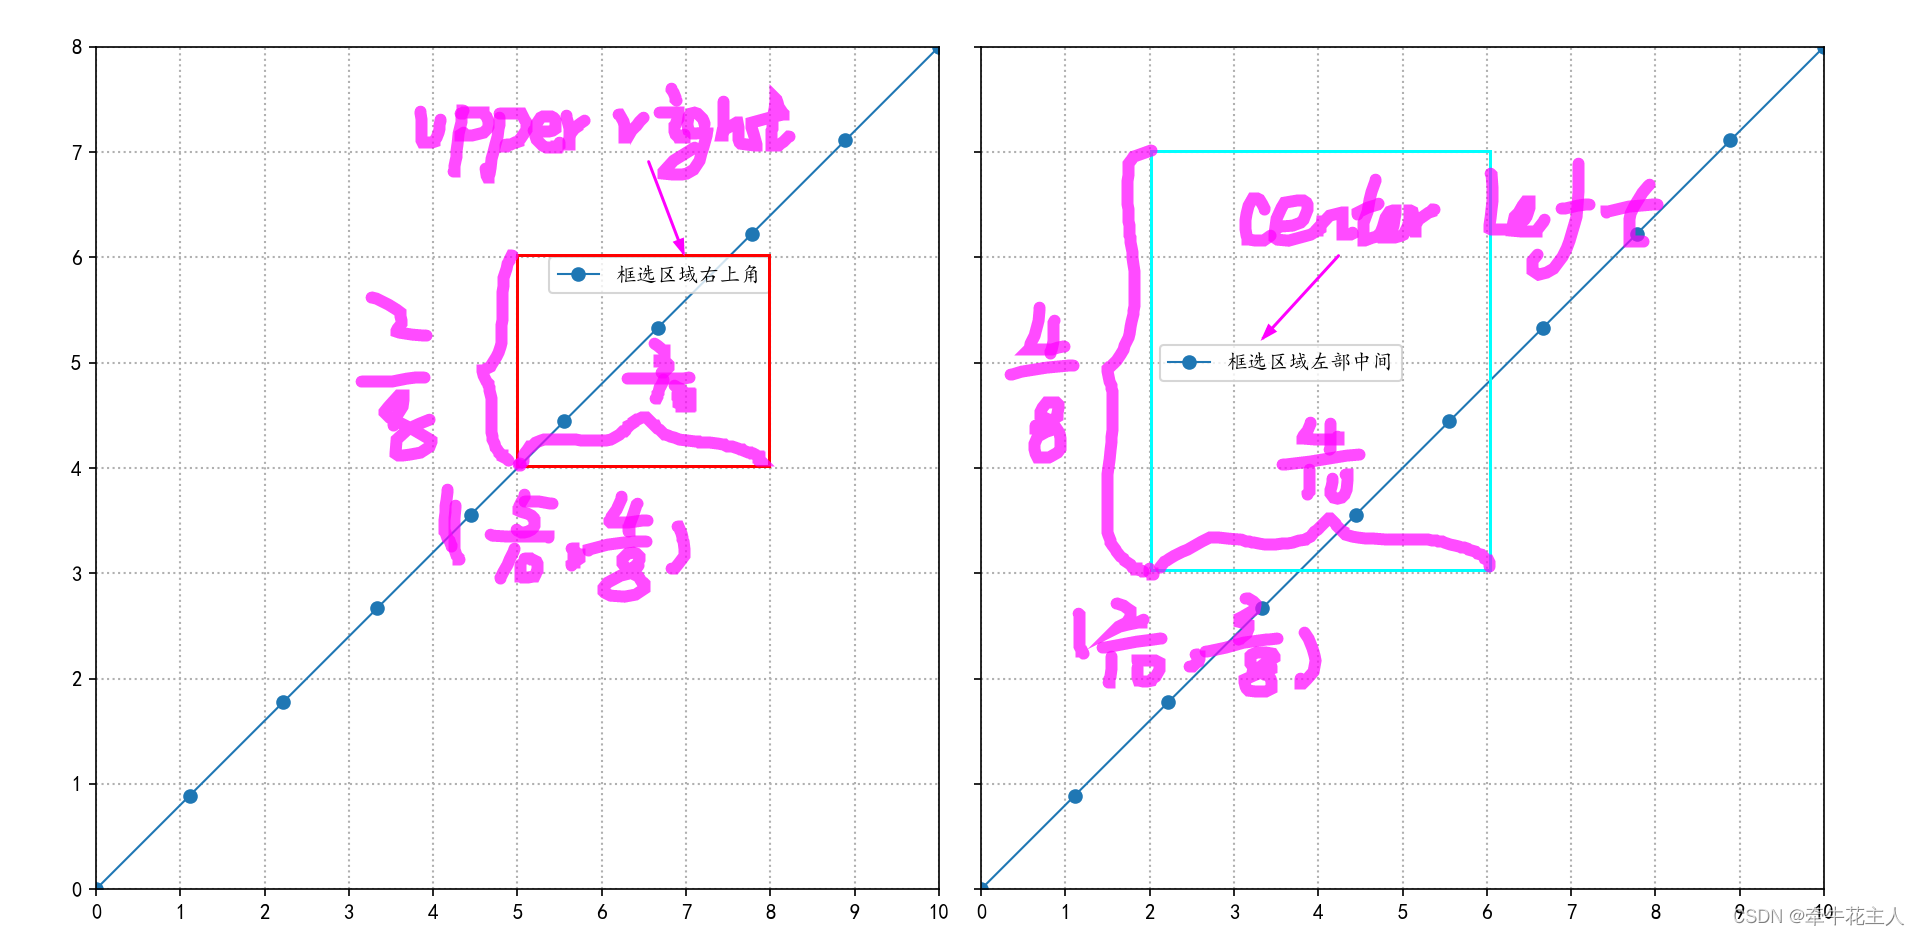
(x, y, width, height),四个参数分别为图例所在参考区域的左下角的坐标位置(x,y),参考区域的宽度与高度(width, height)。图例指定的loc位置位于bbox_to_anchor所确定参考区域的相应位置,如下所示:
import numpy as np
import matplotlib as mpl
import matplotlib.pyplot as plt

mpl.rcParams['font.sans-serif'] = ['KaiTi']
mpl.rcParams['axes.unicode_minus'] = False

x = np.linspace(0, 10, 10)
y1 = np.linspace(0, 8, 10)

fig, ax = plt.subplots(1, 2, sharex=True, sharey=True)
plt.subplots_adjust(left=0.05, right=0.95, top=0.95, bottom=0.05,
                    wspace=0.05, hspace=0)
ax[0].plot(x, y1, marker='o', lw=1, label='框选区域右上角')
ax[0].legend(loc='upper right',bbox_to_anchor=(5/10,4/8,3/10,2/8),
             borderaxespad=0)
ax[0].grid(ls=':', lw=1)
ax[0].set_ylim(0, 8)
ax[0].set_xlim(0, 10)
ax[0].set_xticks(ticks=np.arange(0,11))


ax[1].plot(x, y1, marker='o', lw=1, label='框选区域左部中间')
ax[1].legend(loc='center left',bbox_to_anchor=(2/10,3/8,4/10,4/8))
ax[1].grid(ls=':', lw=1)

plt.show()
3.3 参数: ncols,fontsize,labelcolor
| 参数 | 含义 |
|---|---|
| loc | 字符串或反应相对位置的浮点型数据组成的坐标数据; |
| bbox_to_anchor | 两个或四个浮点数的元组,与loc参数一起决定图例的展示位置 |
| ncols | 图例展示为几列,默认展示为1列,为兼容以前版本也可使用ncol,但不推荐 |
| fontsize | 图例的字体大小,整数或者字符串,取值为整数时,指定字体的大小(单位:磅);取值为字符串时,表示字体相对于默认字体(medium)的大小,字符串取值: {‘xx-small’, ‘x-small’, ‘small’, ‘medium’, ‘large’, ‘x-large’, ‘xx-large’} |
| labelcolor | 图例中文本颜色,默认为黑色,取值可以为单个字符串颜色或颜色列表,也可以使用 ‘linecolor’ 或’markerfacecolor’ (or ‘mfc’), 或 ‘markeredgecolor’ (or ‘mec’)去匹配线条或者标记颜色 |
import numpy as np
import matplotlib as mpl
import matplotlib.pyplot as plt
mpl.rcParams['font.sans-serif'] = ['KaiTi']
mpl.rcParams['axes.unicode_minus'] = False
y = np.arange(5, 0, -1)
d1 = np.array([32, 31, 28, 22, 18])
d2 = np.array([49, 51, 41, 38, 38])
d3 = np.array([19, 18, 31, 40, 44])
cont = ['热门话题', '微博热搜', '关注的大V、KOL', '超话社区', '垂直社区']
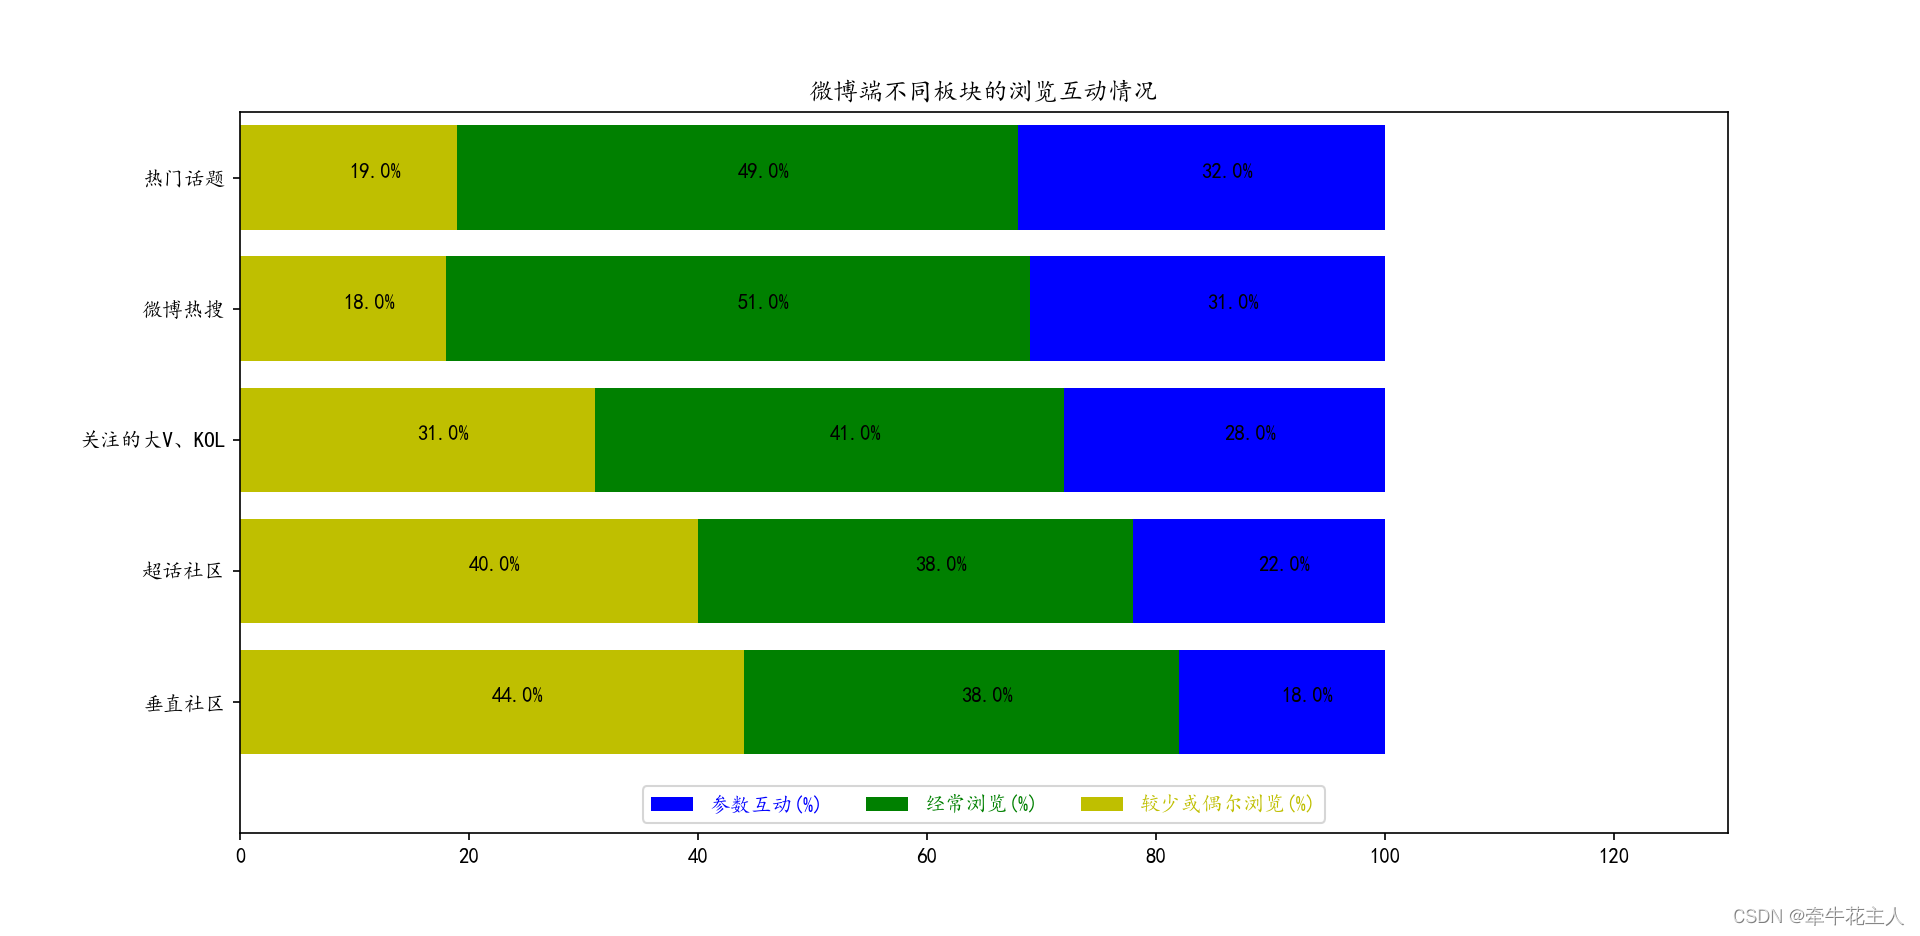
plt.barh(y, d1, color='b', left=d2 + d3, # 默认从left=0开始
tick_label=cont, label='参数互动(%)')
plt.barh(y, d2, left=d3, color='g', label='经常浏览(%)')
plt.barh(y, d3, left=0, color='y', label='较少或偶尔浏览(%)')
for i, j in zip(d3, y):
plt.text(i / 2, j, '%3.1f%%' % i)
for a, b, c in zip(d3, d2, y):
plt.text(a + b / 2, c, '%3.1f%%' % b)
for m, n, p, q in zip(d3, d2, d1, y):
plt.text(m + n + p / 2, q, '%3.1f%%' % p)
plt.title('微博端不同板块的浏览互动情况')
plt.xlim(0, 130)
# print(plt.ylim())
plt.ylim(0, 5.5)
plt.legend(loc='lower center', fontsize=10, ncol=3,
labelcolor=['b','g','y'])
plt.show()
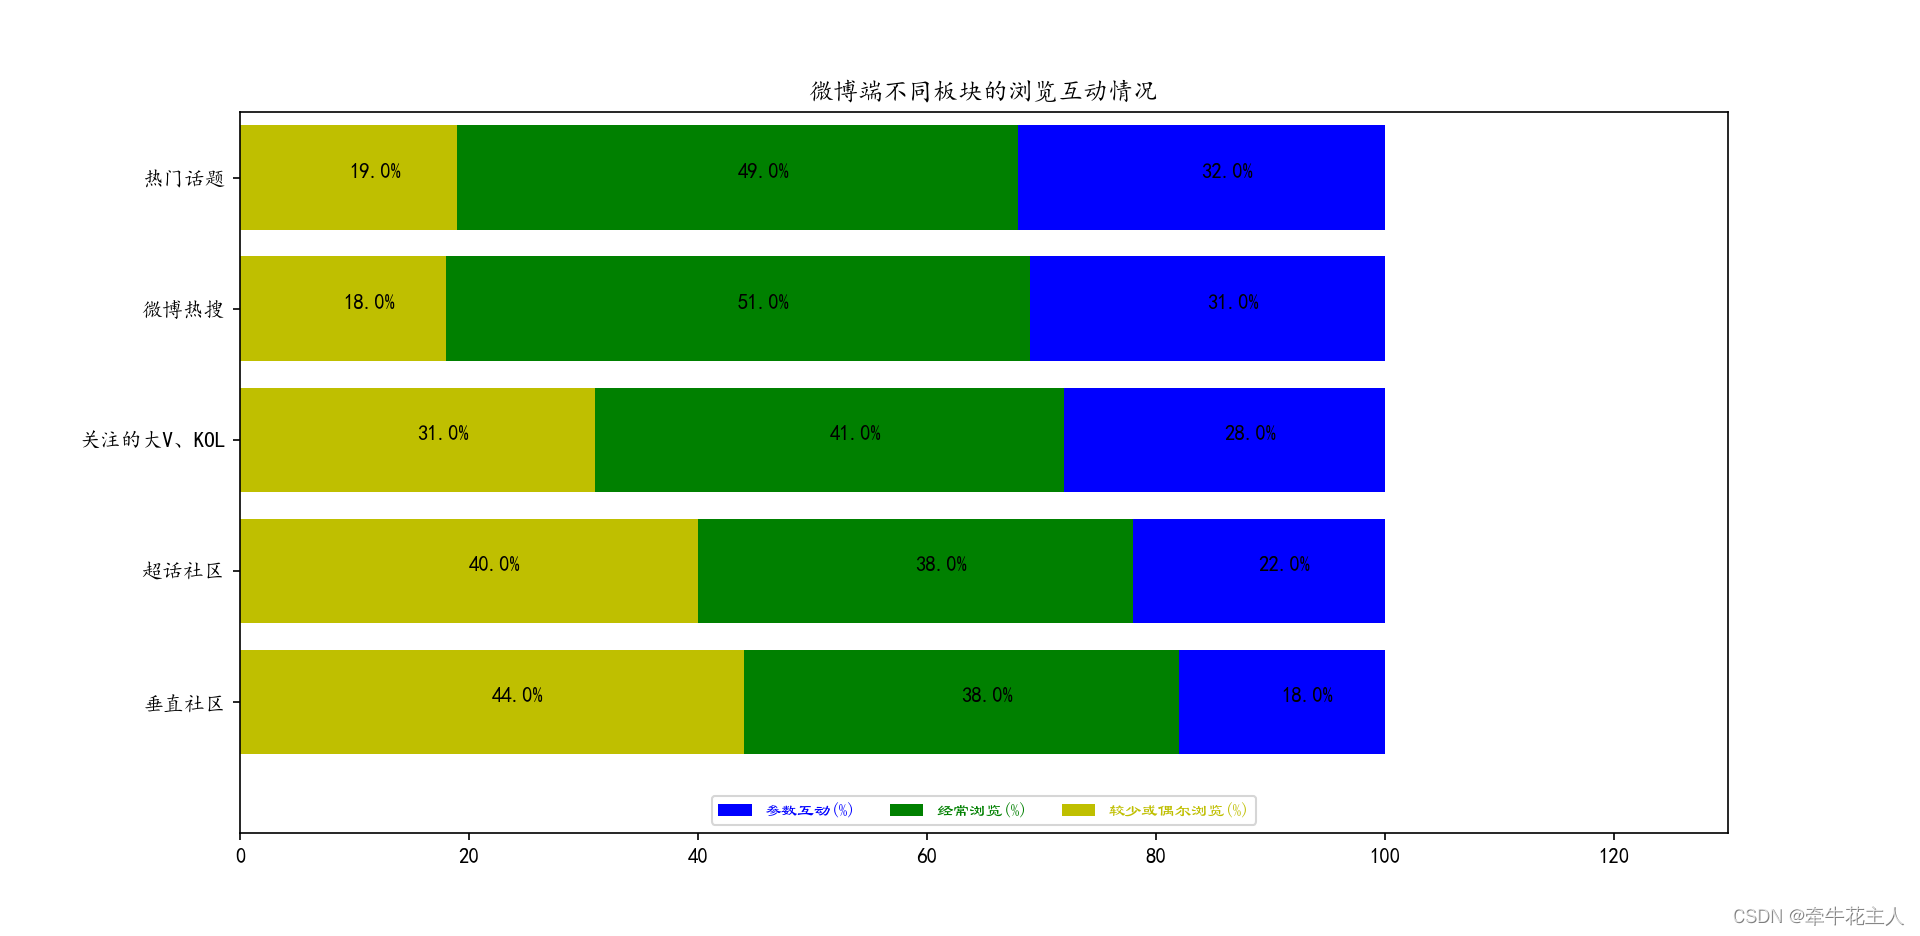
文本颜色与线条颜色保持一致,使用下面的代码可以实现与指定颜色相同的效果:
plt.legend(loc='lower center', ncol=3,
           prop=dict(weight='bold', family='LiSu', size=8),
           fontsize=16,
           labelcolor='linecolor')
3.4 参数:prop
| 参数 | 含义 |
|---|---|
| loc | 字符串或反应相对位置的浮点型数据组成的坐标数据; |
| bbox_to_anchor | 两个或四个浮点数的元组,与loc参数一起决定图例的展示位置 |
| ncols | 图例展示为几列,默认展示为1列,为兼容以前版本也可使用ncol,但不推荐 |
| fontsize | 图例的字体大小,整数或者字符串,取值为整数时,指定字体的大小(单位:磅);取值为字符串时,表示字体相对于默认字体(medium)的大小,字符串取值: {‘xx-small’, ‘x-small’, ‘small’, ‘medium’, ‘large’, ‘x-large’, ‘xx-large’} |
| labelcolor | 图例中文本颜色,默认为黑色,取值可以为单个字符串颜色或颜色列表 |
| prop | 图例的字体属性字典,当该参数存在时,fontsize参数指定的字体大小将不被使用 |
plt.legend(loc='lower center', ncol=3,
           prop=dict(weight='bold', family='LiSu', size=8),
           fontsize=16,
           labelcolor=['b', 'g', 'y'])
plt.show()
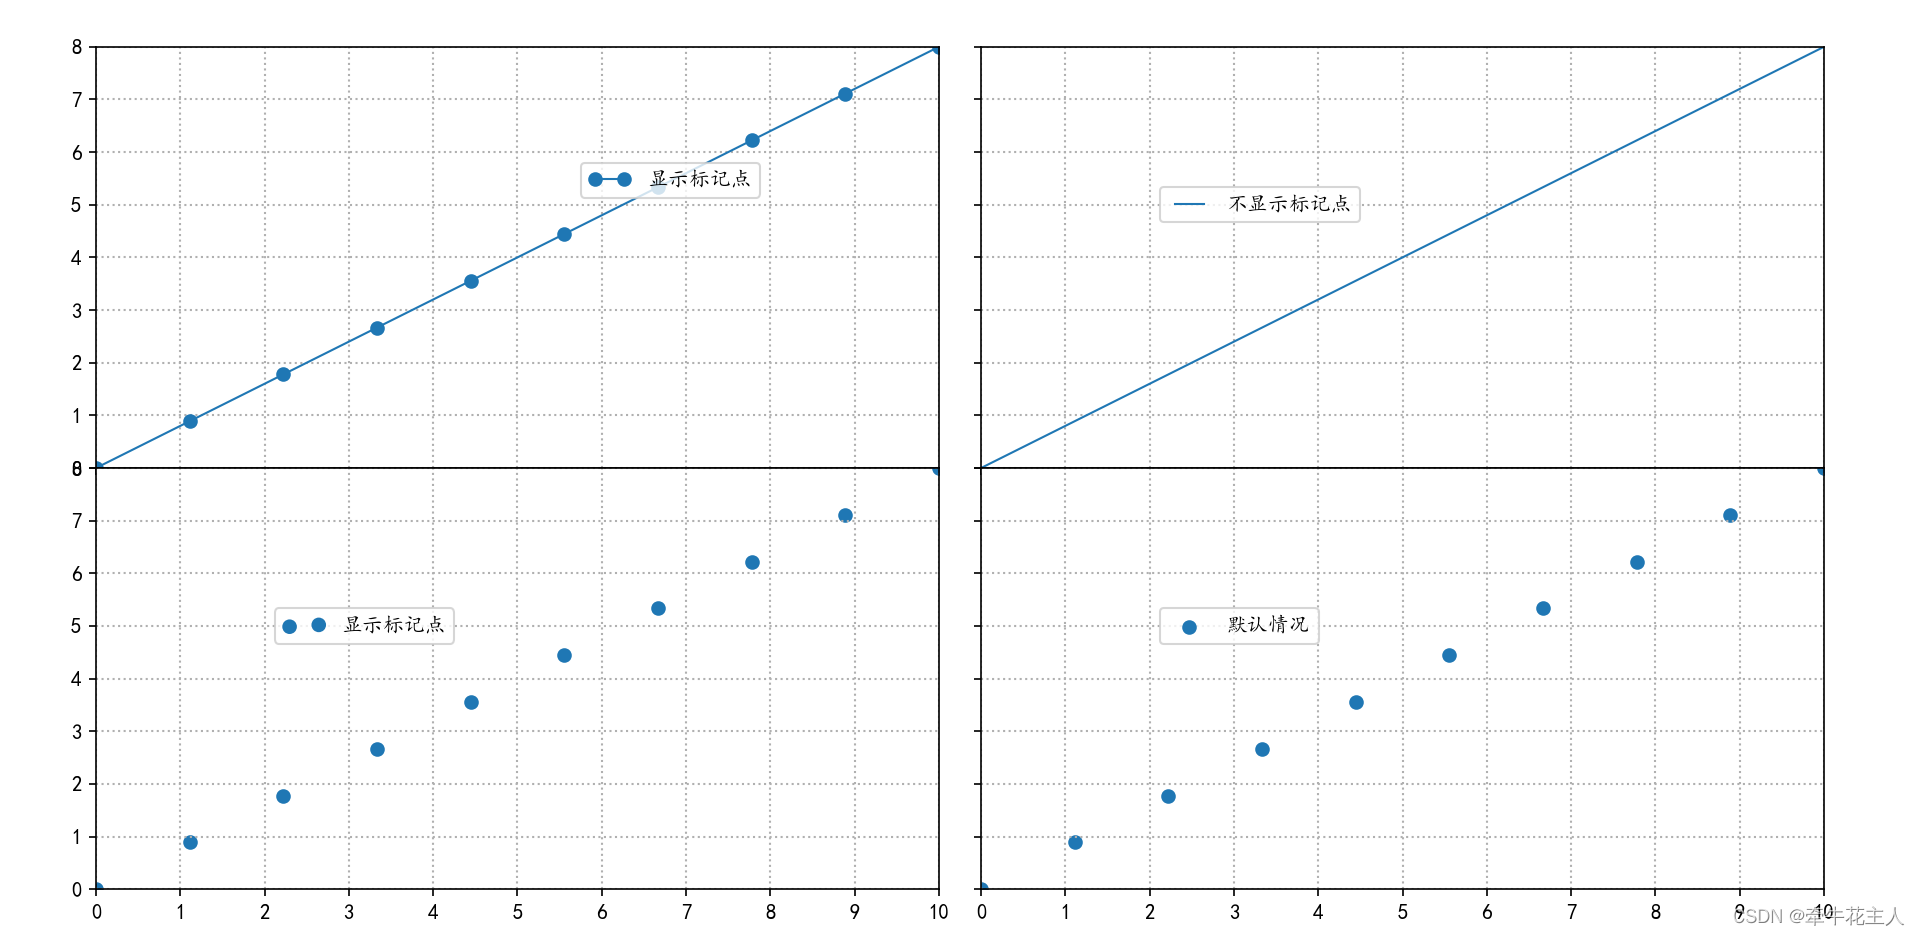
3.5 参数 numpoints、scatterpoints
| 参数 | 含义 |
|---|---|
| loc | 字符串或反应相对位置的浮点型数据组成的坐标数据; |
| bbox_to_anchor | 两个或四个浮点数的元组,与loc参数一起决定图例的展示位置 |
| ncols | 图例展示为几列,默认展示为1列,为兼容以前版本也可使用ncol,但不推荐 |
| fontsize | 图例的字体大小,整数或者字符串,取值为整数时,指定字体的大小(单位:磅);取值为字符串时,表示字体相对于默认字体(medium)的大小,字符串取值: {‘xx-small’, ‘x-small’, ‘small’, ‘medium’, ‘large’, ‘x-large’, ‘xx-large’} |
| labelcolor | 图例中文本颜色,默认为黑色,取值可以为单个字符串颜色或颜色列表 |
| prop | 图例的字体属性字典,当该参数存在时,fontsize参数指定的字体大小将不被使用 |
| numpoints | 绘制折线图时,图例中标记的数量,默认为1个,当绘制折线图标记时才能显示 |
| prop | 绘制散点图时,图例中标记的数量,默认为1个 |
import numpy as np
import matplotlib as mpl
import matplotlib.pyplot as plt

mpl.rcParams['font.sans-serif'] = ['KaiTi']
mpl.rcParams['axes.unicode_minus'] = False

x = np.linspace(0, 10, 10)
y1 = np.linspace(0, 8, 10)

fig, ax = plt.subplots(2, 2, sharex=True, sharey=True)
plt.subplots_adjust(left=0.05, right=0.95, top=0.95, bottom=0.05,
                    wspace=0.05, hspace=0)
ax[0,0].plot(x, y1, marker='o', lw=1, label='显示标记点')
ax[0,0].legend(loc='upper right',bbox_to_anchor=(5/10,4/8,3/10,2/8),
             numpoints=2)
ax[0,0].grid(ls=':', lw=1)
ax[0,0].set_ylim(0, 8)
ax[0,0].set_xlim(0, 10)
ax[0,0].set_xticks(ticks=np.arange(0,11))


ax[0,1].plot(x, y1, lw=1, label='不显示标记点')
ax[0,1].legend(loc='center left',bbox_to_anchor=(2/10,3/8,4/10,4/8),
             numpoints=2)
ax[0,1].grid(ls=':', lw=1)

ax[1,0].scatter(x, y1, lw=1, label='显示标记点')
ax[1,0].legend(loc='center left',bbox_to_anchor=(2/10,3/8,4/10,4/8),
             scatterpoints=2)
ax[1,0].grid(ls=':', lw=1)


ax[1,1].scatter(x, y1, lw=1, label='默认情况')
ax[1,1].legend(loc='center left',bbox_to_anchor=(2/10,3/8,4/10,4/8))
ax[1,1].grid(ls=':', lw=1)

plt.show()
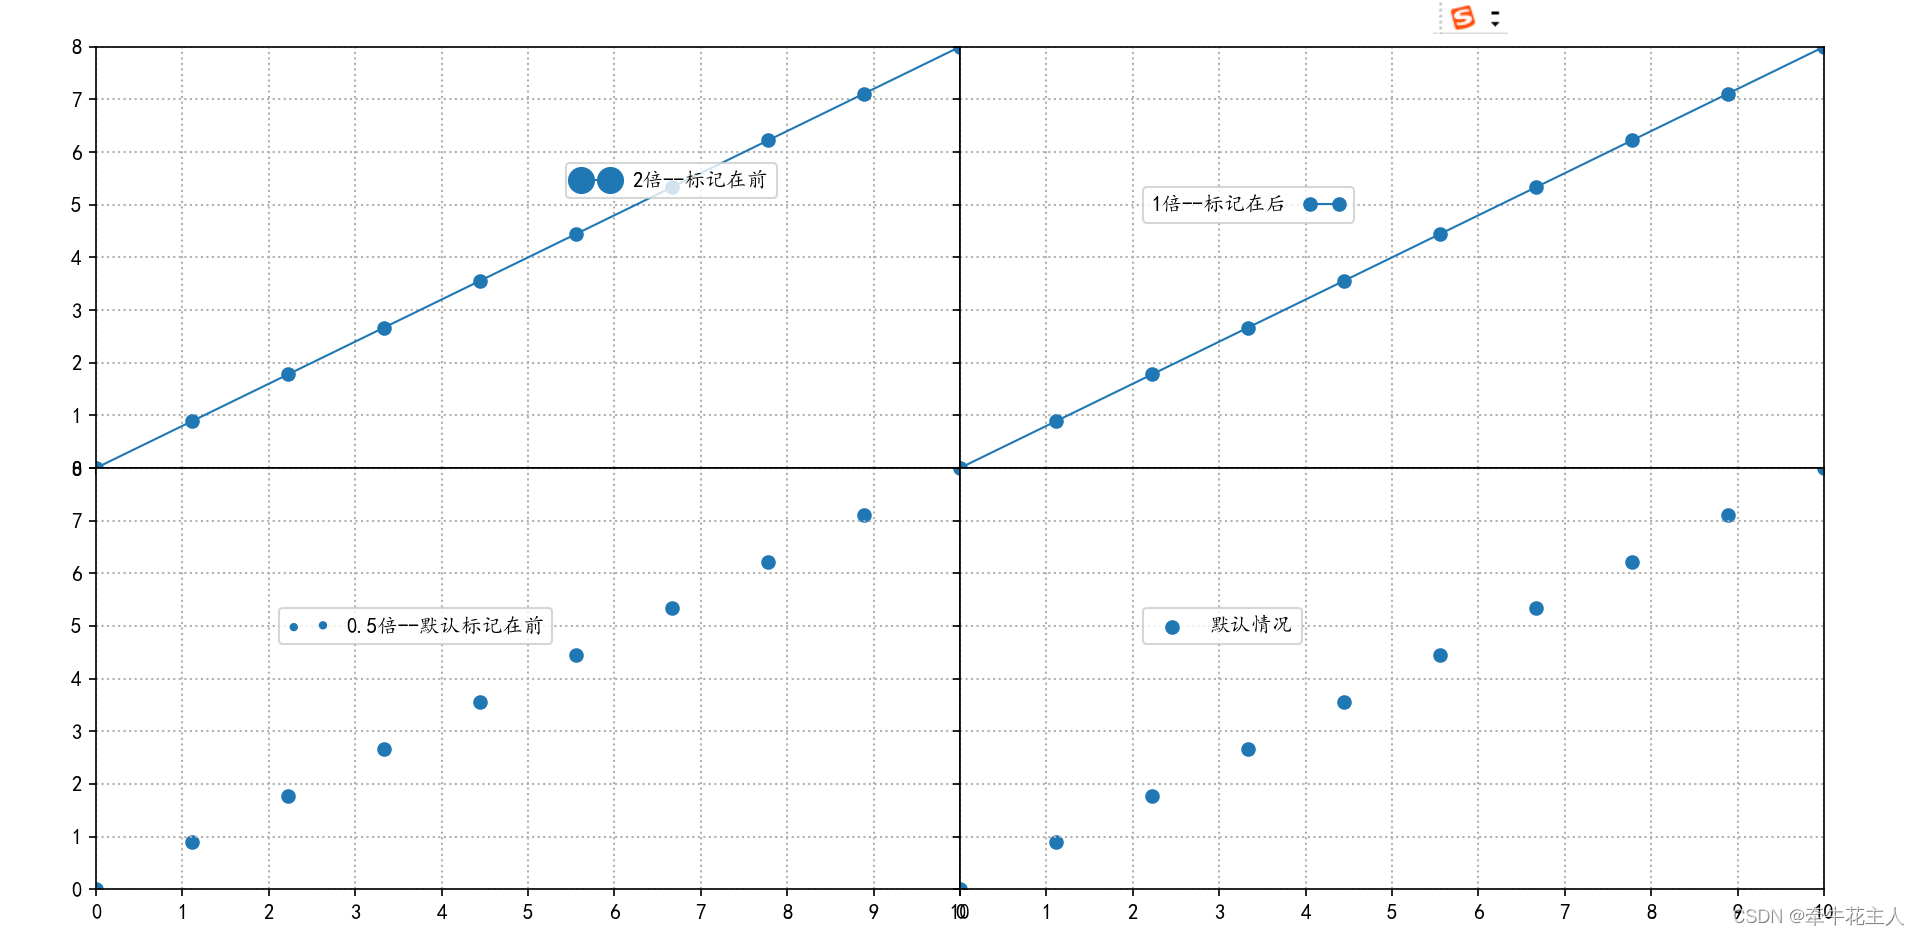
3.6 参数markerscale、markerfirst
| 参数 | 含义 |
|---|---|
| loc | 字符串或反应相对位置的浮点型数据组成的坐标数据; |
| bbox_to_anchor | 两个或四个浮点数的元组,与loc参数一起决定图例的展示位置 |
| ncols | 图例展示为几列,默认展示为1列,为兼容以前版本也可使用ncol,但不推荐 |
| fontsize | 图例的字体大小,整数或者字符串,取值为整数时,指定字体的大小(单位:磅);取值为字符串时,表示字体相对于默认字体(medium)的大小,字符串取值: {‘xx-small’, ‘x-small’, ‘small’, ‘medium’, ‘large’, ‘x-large’, ‘xx-large’} |
| labelcolor | 图例中文本颜色,默认为黑色,取值可以为单个字符串颜色或颜色列表 |
| prop | 图例的字体属性字典,当该参数存在时,fontsize参数指定的字体大小将不被使用 |
| numpoints | 绘制折线图时,图例中标记的数量,默认为1个,当绘制折线图标记时才能显示 |
| prop | 绘制散点图时,图例中标记的数量,默认为1个 |
| markerscale | 图例中的标记相对于图中的原始大小 |
| markerfirst | 布尔值,默认取值为True,表示图例中的标记放在标签左边;取值为False表示图例标记放在标签右边 |
import matplotlib.pyplot as plt
import numpy as np
import matplotlib as mpl
import matplotlib.pyplot as plt

mpl.rcParams['font.sans-serif'] = ['KaiTi']
mpl.rcParams['axes.unicode_minus'] = False

x = np.linspace(0, 10, 10)
y1 = np.linspace(0, 8, 10)

fig, ax = plt.subplots(2, 2, sharex=True, sharey=True)
plt.subplots_adjust(left=0.05, right=0.95, top=0.95, bottom=0.05,
                    wspace=0.0, hspace=0)
ax[0,0].plot(x, y1, marker='o', lw=1, label='2倍--标记在前')
ax[0,0].legend(loc='upper right',bbox_to_anchor=(5/10,4/8,3/10,2/8),
             numpoints=2, markerscale=2,markerfirst=True)
ax[0,0].grid(ls=':', lw=1)
ax[0,0].set_ylim(0, 8)
ax[0,0].set_xlim(0, 10)
ax[0,0].set_xticks(ticks=np.arange(0,11))


ax[0,1].plot(x, y1, lw=1,marker='o', label='1倍--标记在后')
ax[0,1].legend(loc='center left',bbox_to_anchor=(2/10,3/8,4/10,4/8),
             numpoints=2, markerscale=1,markerfirst=False)
ax[0,1].grid(ls=':', lw=1)

ax[1,0].scatter(x, y1, lw=1, label='0.5倍--默认标记在前')
ax[1,0].legend(loc='center left',bbox_to_anchor=(2/10,3/8,4/10,4/8),
             scatterpoints=2, markerscale=0.5)
ax[1,0].grid(ls=':', lw=1)


ax[1,1].scatter(x, y1, lw=1, label='默认情况')
ax[1,1].legend(loc='center left',bbox_to_anchor=(2/10,3/8,4/10,4/8))
ax[1,1].grid(ls=':', lw=1)

plt.show()
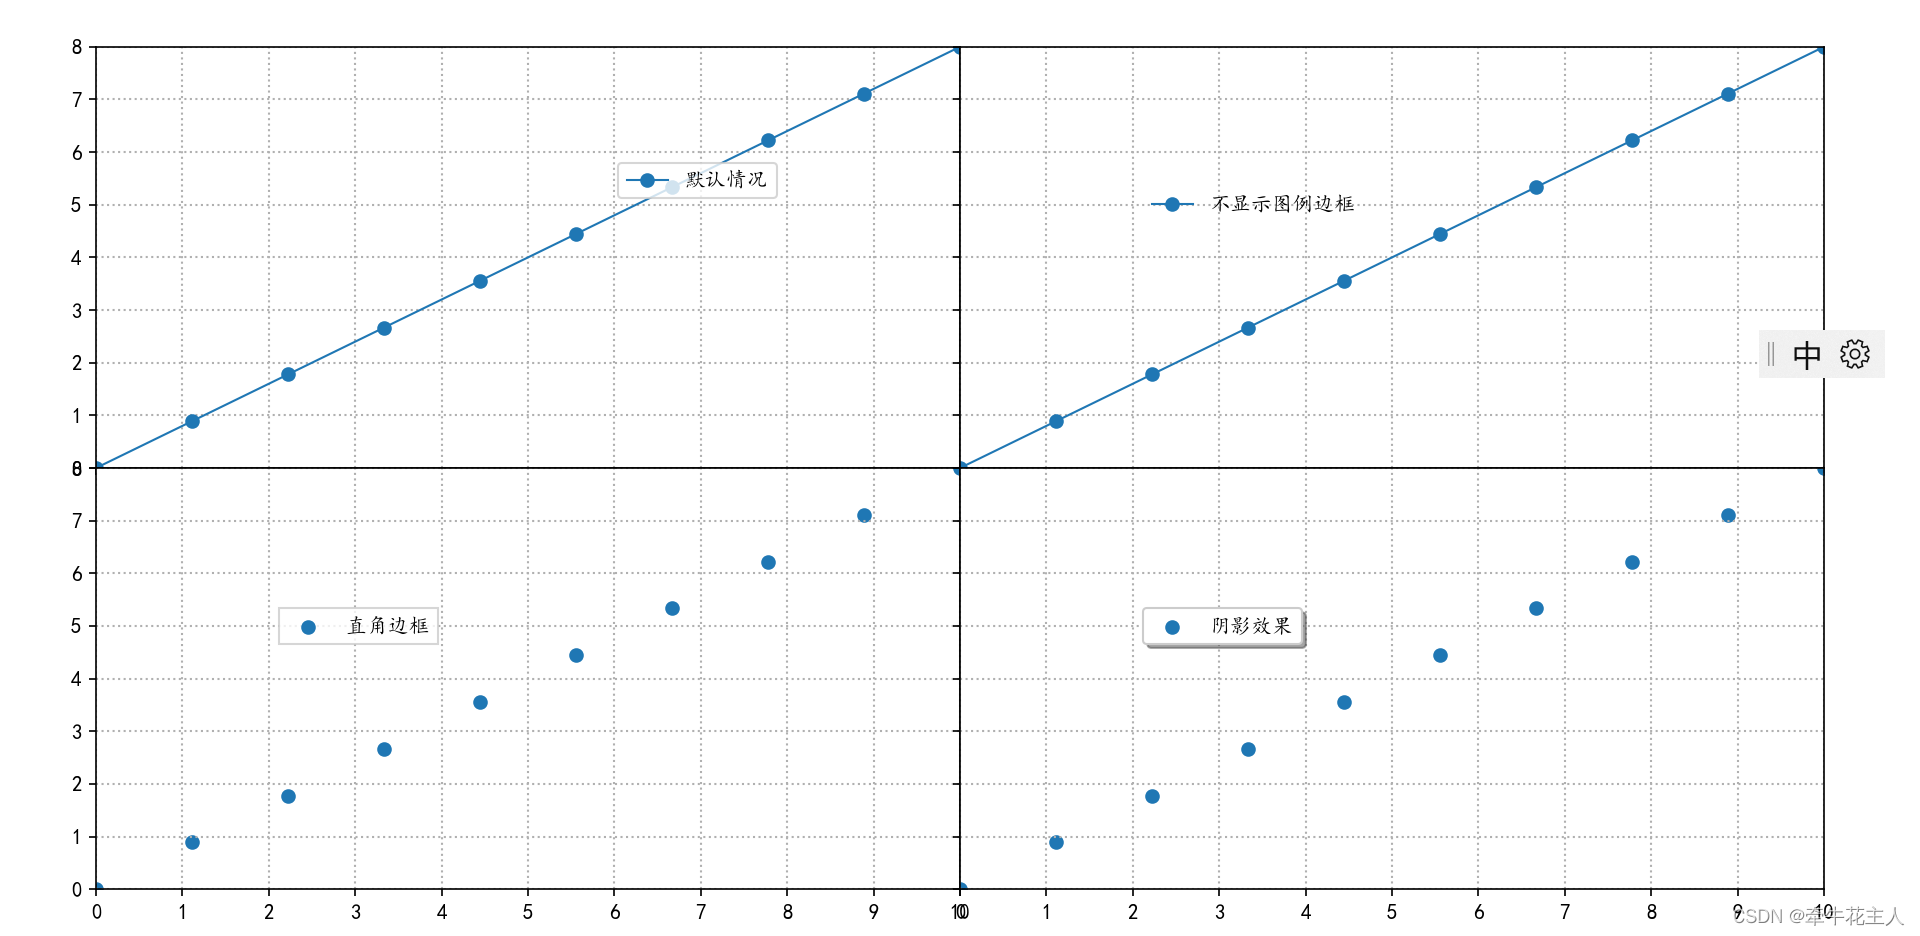
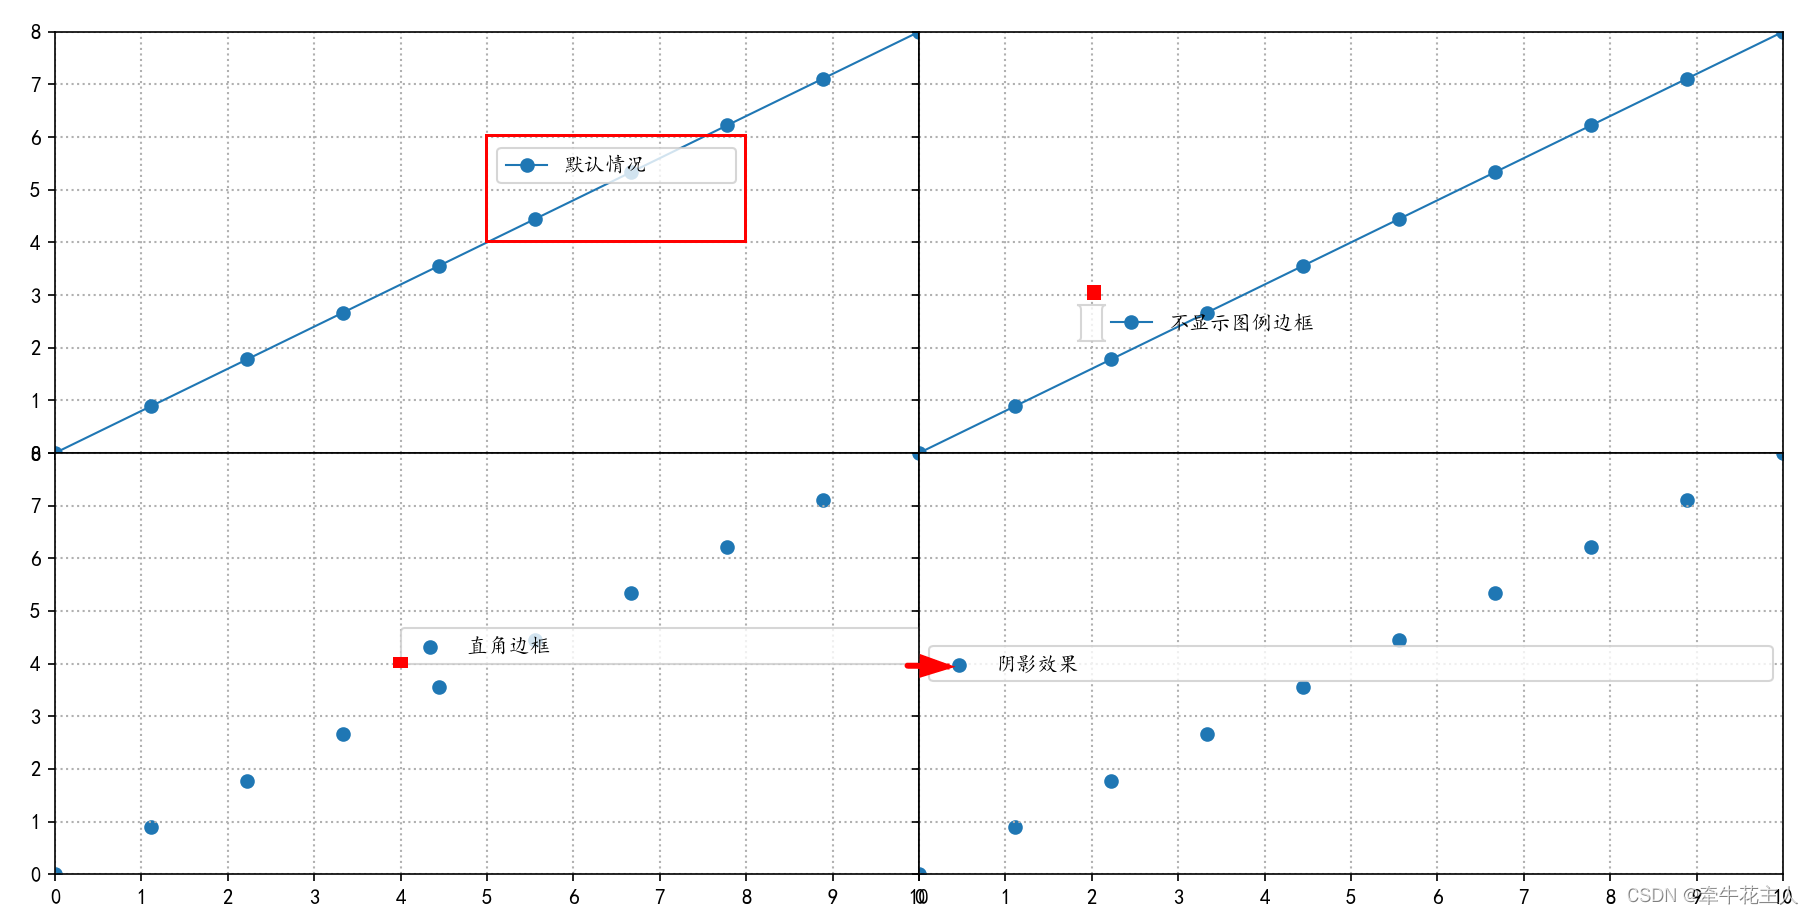
3.7 参数 frameon、fancybox、shadow
| 参数 | 含义 |
|---|---|
| loc | 字符串或反应相对位置的浮点型数据组成的坐标数据; |
| bbox_to_anchor | 两个或四个浮点数的元组,与loc参数一起决定图例的展示位置 |
| ncols | 图例展示为几列,默认展示为1列,为兼容以前版本也可使用ncol,但不推荐 |
| fontsize | 图例的字体大小,整数或者字符串,取值为整数时,指定字体的大小(单位:磅);取值为字符串时,表示字体相对于默认字体(medium)的大小,字符串取值: {‘xx-small’, ‘x-small’, ‘small’, ‘medium’, ‘large’, ‘x-large’, ‘xx-large’} |
| labelcolor | 图例中文本颜色,默认为黑色,取值可以为单个字符串颜色或颜色列表 |
| prop | 图例的字体属性字典,当该参数存在时,fontsize参数指定的字体大小将不被使用 |
| numpoints | 绘制折线图时,图例中标记的数量,默认为1个,当绘制折线图标记时才能显示 |
| prop | 绘制散点图时,图例中标记的数量,默认为1个 |
| markerscale | 图例中的标记相对于图中的原始大小 |
| markerfirst | 布尔值,默认取值为True,表示图例中的标记放在标签左边;取值为False表示图例标记放在标签右边 |
| frameon | 布尔值,是否显示图例边框,默认取值为True:显示 |
| fancybox | 布尔值,是否绘制圆角边框,默认取值为True:显示 |
| shadow | 布尔值,是否显示图例的阴影效果,默认取值为False:不显示 |
import matplotlib.pyplot as plt
import numpy as np
import matplotlib as mpl
import matplotlib.pyplot as plt

mpl.rcParams['font.sans-serif'] = ['KaiTi']
mpl.rcParams['axes.unicode_minus'] = False

x = np.linspace(0, 10, 10)
y1 = np.linspace(0, 8, 10)

fig, ax = plt.subplots(2, 2, sharex=True, sharey=True)
plt.subplots_adjust(left=0.05, right=0.95, top=0.95, bottom=0.05,
                    wspace=0.0, hspace=0)
ax[0,0].plot(x, y1, marker='o', lw=1, label='默认情况')
ax[0,0].legend(loc='upper right',bbox_to_anchor=(5/10,4/8,3/10,2/8),
             )
ax[0,0].grid(ls=':', lw=1)
ax[0,0].set_ylim(0, 8)
ax[0,0].set_xlim(0, 10)
ax[0,0].set_xticks(ticks=np.arange(0,11))


ax[0,1].plot(x, y1, lw=1,marker='o', label='不显示图例边框')
ax[0,1].legend(loc='center left',bbox_to_anchor=(2/10,3/8,4/10,4/8),
               frameon=False)
ax[0,1].grid(ls=':', lw=1)

ax[1,0].scatter(x, y1, lw=1, label='直角边框')
ax[1,0].legend(loc='center left',bbox_to_anchor=(2/10,3/8,4/10,4/8),
             fancybox=False)
ax[1,0].grid(ls=':', lw=1)


ax[1,1].scatter(x, y1, lw=1, label='阴影效果')
ax[1,1].legend(loc='center left',bbox_to_anchor=(2/10,3/8,4/10,4/8),
               shadow=True)
ax[1,1].grid(ls=':', lw=1)

plt.show()
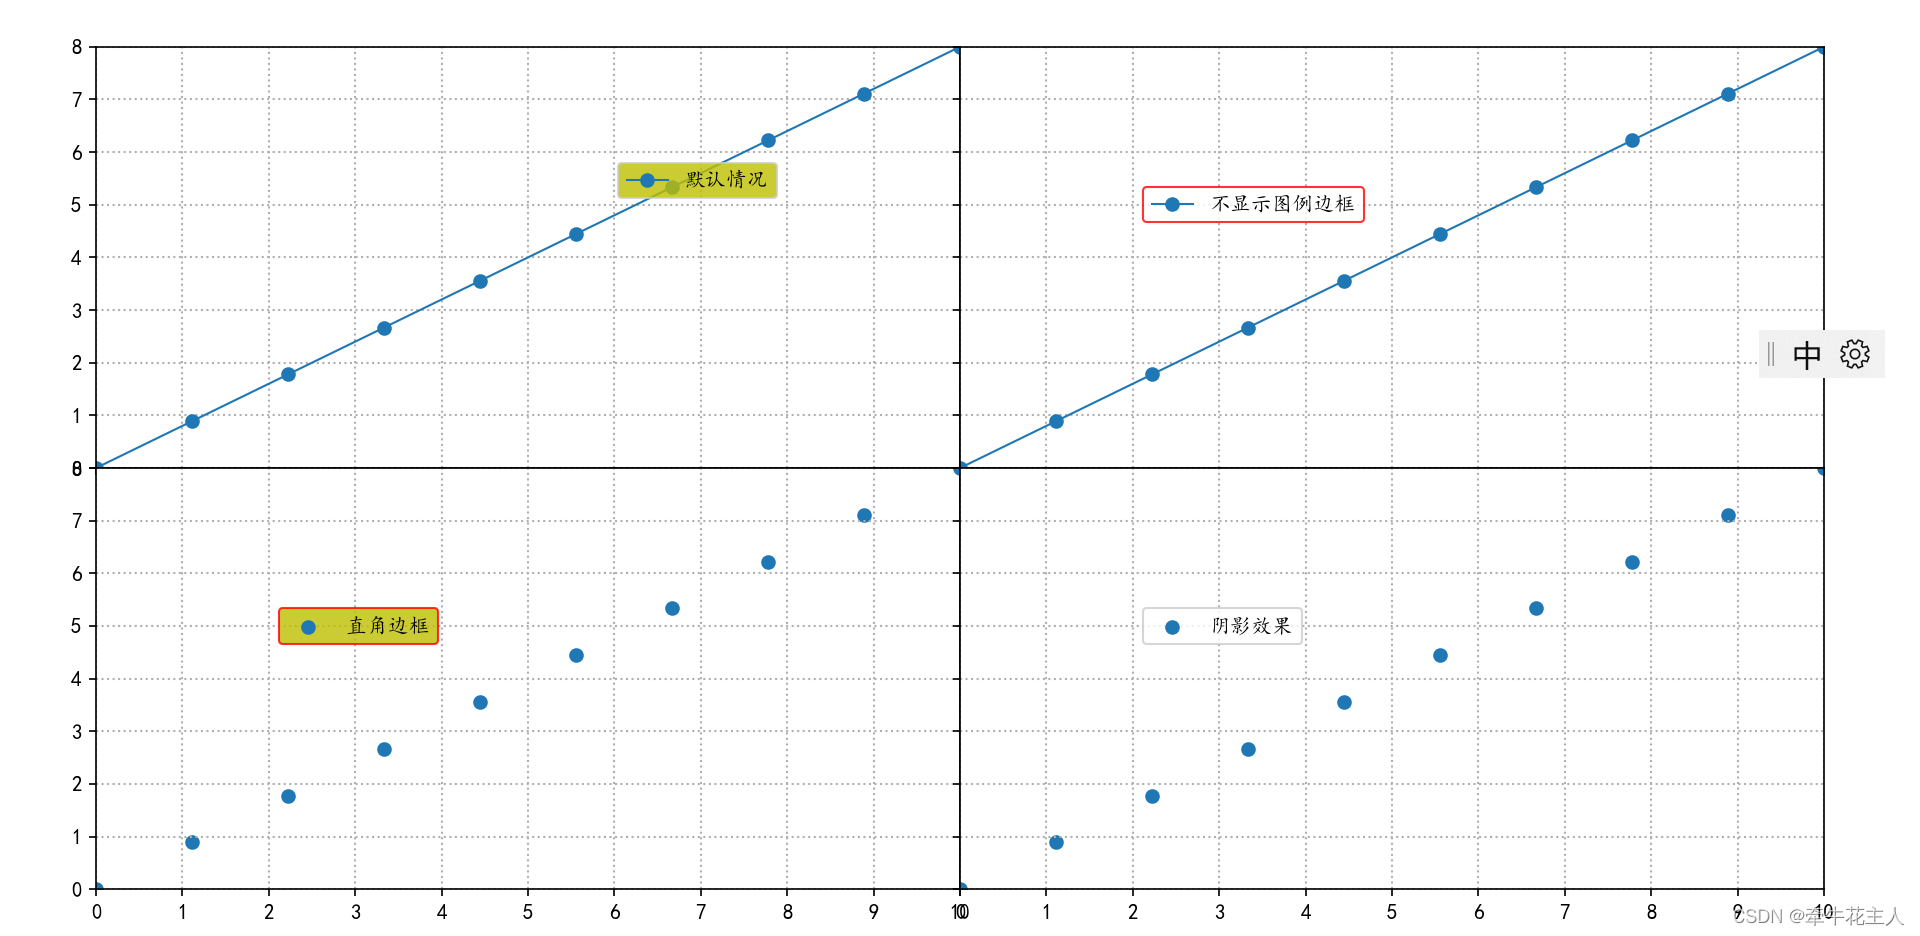
3.8 参数facecolor、edgecolor
| 参数 | 含义 |
|---|---|
| loc | 字符串或反应相对位置的浮点型数据组成的坐标数据; |
| bbox_to_anchor | 两个或四个浮点数的元组,与loc参数一起决定图例的展示位置 |
| ncols | 图例展示为几列,默认展示为1列,为兼容以前版本也可使用ncol,但不推荐 |
| fontsize | 图例的字体大小,整数或者字符串,取值为整数时,指定字体的大小(单位:磅);取值为字符串时,表示字体相对于默认字体(medium)的大小,字符串取值: {‘xx-small’, ‘x-small’, ‘small’, ‘medium’, ‘large’, ‘x-large’, ‘xx-large’} |
| labelcolor | 图例中文本颜色,默认为黑色,取值可以为单个字符串颜色或颜色列表 |
| prop | 图例的字体属性字典,当该参数存在时,fontsize参数指定的字体大小将不被使用 |
| numpoints | 绘制折线图时,图例中标记的数量,默认为1个,当绘制折线图标记时才能显示 |
| prop | 绘制散点图时,图例中标记的数量,默认为1个 |
| markerscale | 图例中的标记相对于图中的原始大小 |
| markerfirst | 布尔值,默认取值为True,表示图例中的标记放在标签左边;取值为False表示图例标记放在标签右边 |
| frameon | 布尔值,是否显示图例边框,默认取值为True:显示 |
| fancybox | 布尔值,是否绘制圆角边框,默认取值为True:显示 |
| shadow | 布尔值,是否显示图例的阴影效果,默认取值为False:不显示 |
| facecolor | 图例填充颜色,默认为白色 |
| edgecolor | 图例边界颜色,默认为白色 |
import matplotlib.pyplot as plt
import numpy as np
import matplotlib as mpl
import matplotlib.pyplot as plt

mpl.rcParams['font.sans-serif'] = ['KaiTi']
mpl.rcParams['axes.unicode_minus'] = False

x = np.linspace(0, 10, 10)
y1 = np.linspace(0, 8, 10)

fig, ax = plt.subplots(2, 2, sharex=True, sharey=True)
plt.subplots_adjust(left=0.05, right=0.95, top=0.95, bottom=0.05,
                    wspace=0.0, hspace=0)
ax[0, 0].plot(x, y1, marker='o', lw=1, label='默认情况')
ax[0, 0].legend(loc='upper right', bbox_to_anchor=(5 / 10, 4 / 8, 3 / 10, 2 / 8),
                facecolor='y')
ax[0, 0].grid(ls=':', lw=1)
ax[0, 0].set_ylim(0, 8)
ax[0, 0].set_xlim(0, 10)
ax[0, 0].set_xticks(ticks=np.arange(0, 11))

ax[0, 1].plot(x, y1, lw=1, marker='o', label='不显示图例边框')
ax[0, 1].legend(loc='center left', bbox_to_anchor=(2 / 10, 3 / 8, 4 / 10, 4 / 8),
                edgecolor='r')
ax[0, 1].grid(ls=':', lw=1)

ax[1, 0].scatter(x, y1, lw=1, label='直角边框')
ax[1, 0].legend(loc='center left', bbox_to_anchor=(2 / 10, 3 / 8, 4 / 10, 4 / 8),
                facecolor='y', edgecolor='r')
ax[1, 0].grid(ls=':', lw=1)

ax[1, 1].scatter(x, y1, lw=1, label='阴影效果')
ax[1, 1].legend(loc='center left', bbox_to_anchor=(2 / 10, 3 / 8, 4 / 10, 4 / 8),
                )
ax[1, 1].grid(ls=':', lw=1)

plt.show()
3.9 参数: mode
| 参数 | 含义 |
|---|---|
| loc | 字符串或反应相对位置的浮点型数据组成的坐标数据; |
| bbox_to_anchor | 两个或四个浮点数的元组,与loc参数一起决定图例的展示位置 |
| ncols | 图例展示为几列,默认展示为1列,为兼容以前版本也可使用ncol,但不推荐 |
| fontsize | 图例的字体大小,整数或者字符串,取值为整数时,指定字体的大小(单位:磅);取值为字符串时,表示字体相对于默认字体(medium)的大小,字符串取值: {‘xx-small’, ‘x-small’, ‘small’, ‘medium’, ‘large’, ‘x-large’, ‘xx-large’} |
| labelcolor | 图例中文本颜色,默认为黑色,取值可以为单个字符串颜色或颜色列表 |
| prop | 图例的字体属性字典,当该参数存在时,fontsize参数指定的字体大小将不被使用 |
| numpoints | 绘制折线图时,图例中标记的数量,默认为1个,当绘制折线图标记时才能显示 |
| prop | 绘制散点图时,图例中标记的数量,默认为1个 |
| markerscale | 图例中的标记相对于图中的原始大小 |
| markerfirst | 布尔值,默认取值为True,表示图例中的标记放在标签左边;取值为False表示图例标记放在标签右边 |
| frameon | 布尔值,是否显示图例边框,默认取值为True:显示 |
| fancybox | 布尔值,是否绘制圆角边框,默认取值为True:显示 |
| shadow | 布尔值,是否显示图例的阴影效果,默认取值为False:不显示 |
| facecolor | 图例填充颜色,默认为白色 |
| edgecolor | 图例边界颜色,默认为白色 |
| mode | 取值为expand或None;当取值为expand时,图例将在水平方向扩展填充,填充到参考区域的最后边 |
x = np.linspace(0, 10, 10)
y1 = np.linspace(0, 8, 10)

fig, ax = plt.subplots(2, 2, sharex=True, sharey=True)
plt.subplots_adjust(left=0.05, right=0.95, top=0.95, bottom=0.05,
                    wspace=0.0, hspace=0)
ax[0, 0].plot(x, y1, marker='o', lw=1, label='默认情况')
ax[0, 0].legend(loc='upper right',
                bbox_to_anchor=(5 / 10, 4 / 8, 3 / 10, 2 / 8),
                mode='expand')
ax[0, 0].grid(ls=':', lw=1)
ax[0, 0].set_ylim(0, 8)
ax[0, 0].set_xlim(0, 10)
ax[0, 0].set_xticks(ticks=np.arange(0, 11))

ax[0, 1].plot(x, y1, lw=1, marker='o', label='不显示图例边框')
ax[0, 1].legend(loc='upper left', bbox_to_anchor=(2 / 10, 3 / 8),
                mode='expand')
ax[0, 1].grid(ls=':', lw=1)

ax[1, 0].scatter(x, y1, lw=1, label='直角边框')
ax[1, 0].legend(loc=(4 / 10, 4 / 8), mode='expand')
ax[1, 0].grid(ls=':', lw=1)

ax[1, 1].scatter(x, y1, lw=1, label='阴影效果')
ax[1, 1].legend(loc='center left',
                mode='expand')
ax[1, 1].grid(ls=':', lw=1)
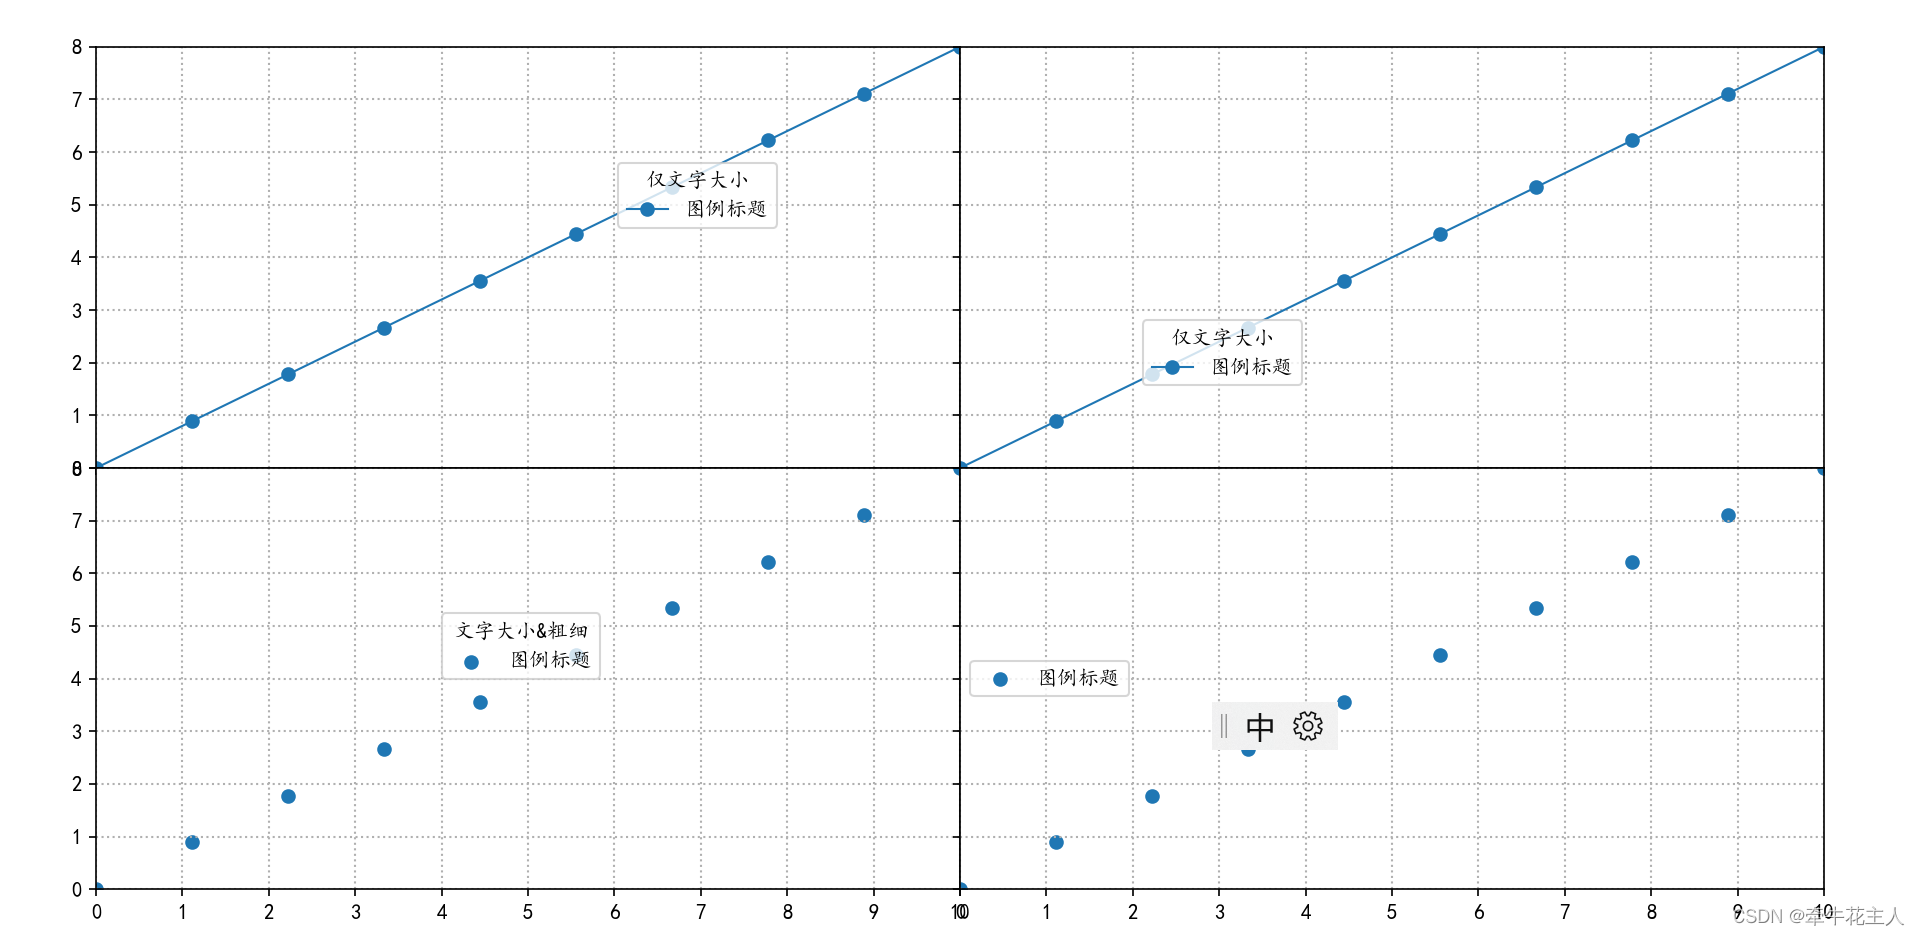
3.10 参数title、title_fontproperties
| 参数 | 含义 |
|---|---|
| loc | 字符串或反应相对位置的浮点型数据组成的坐标数据; |
| bbox_to_anchor | 两个或四个浮点数的元组,与loc参数一起决定图例的展示位置 |
| ncols | 图例展示为几列,默认展示为1列,为兼容以前版本也可使用ncol,但不推荐 |
| fontsize | 图例的字体大小,整数或者字符串,取值为整数时,指定字体的大小(单位:磅);取值为字符串时,表示字体相对于默认字体(medium)的大小,字符串取值: {‘xx-small’, ‘x-small’, ‘small’, ‘medium’, ‘large’, ‘x-large’, ‘xx-large’} |
| labelcolor | 图例中文本颜色,默认为黑色,取值可以为单个字符串颜色或颜色列表 |
| prop | 图例的字体属性字典,当该参数存在时,fontsize参数指定的字体大小将不被使用 |
| numpoints | 绘制折线图时,图例中标记的数量,默认为1个,当绘制折线图标记时才能显示 |
| prop | 绘制散点图时,图例中标记的数量,默认为1个 |
| markerscale | 图例中的标记相对于图中的原始大小 |
| markerfirst | 布尔值,默认取值为True,表示图例中的标记放在标签左边;取值为False表示图例标记放在标签右边 |
| frameon | 布尔值,是否显示图例边框,默认取值为True:显示 |
| fancybox | 布尔值,是否绘制圆角边框,默认取值为True:显示 |
| shadow | 布尔值,是否显示图例的阴影效果,默认取值为False:不显示 |
| facecolor | 图例填充颜色,默认为白色 |
| edgecolor | 图例边界颜色,默认为白色 |
| mode | 取值为expand或None;当取值为expand时,图例将在水平方向扩展填充,填充到参考区域的最后边 |
| title | 图例标题,默认无标题 |
| title_fontproperties | 图例标题字体属性 |
| title_fontsize | 取值为整数或 {‘xx-small’, ‘x-small’, ‘small’, ‘medium’, ‘large’, ‘x-large’, ‘xx-large’};图例字体大小,若同时需要设置其他字体属性,使用title_fontproperties属性;fontsize与title_propertiies两个参数不用同时使用 |
x = np.linspace(0, 10, 10)
y1 = np.linspace(0, 8, 10)

fig, ax = plt.subplots(2, 2, sharex=True, sharey=True)
plt.subplots_adjust(left=0.05, right=0.95, top=0.95, bottom=0.05,
                    wspace=0.0, hspace=0)
ax[0, 0].plot(x, y1, marker='o', lw=1, label='图例标题')
ax[0, 0].legend(loc='upper right',bbox_to_anchor=(5 / 10, 4 / 8, 3 / 10, 2 / 8),
                title='仅文字大小',title_fontsize=10
              )
ax[0, 0].grid(ls=':', lw=1)
ax[0, 0].set_ylim(0, 8)
ax[0, 0].set_xlim(0, 10)
ax[0, 0].set_xticks(ticks=np.arange(0, 11))

ax[0, 1].plot(x, y1, lw=1, marker='o', label='图例标题')
ax[0, 1].legend(loc='upper left', bbox_to_anchor=(2 / 10, 3 / 8),
                title='仅文字大小',title_fontproperties=dict(size=10))
ax[0, 1].grid(ls=':', lw=1)

ax[1, 0].scatter(x, y1, lw=1, label='图例标题')
ax[1, 0].legend(loc=(4 / 10, 4 / 8), title='文字大小&粗细',
                 title_fontproperties=dict(size=10, weight='bold'))
ax[1, 0].grid(ls=':', lw=1)

ax[1, 1].scatter(x, y1, lw=1, label='图例标题')
ax[1, 1].legend(loc='center left', )
ax[1, 1].grid(ls=':', lw=1)
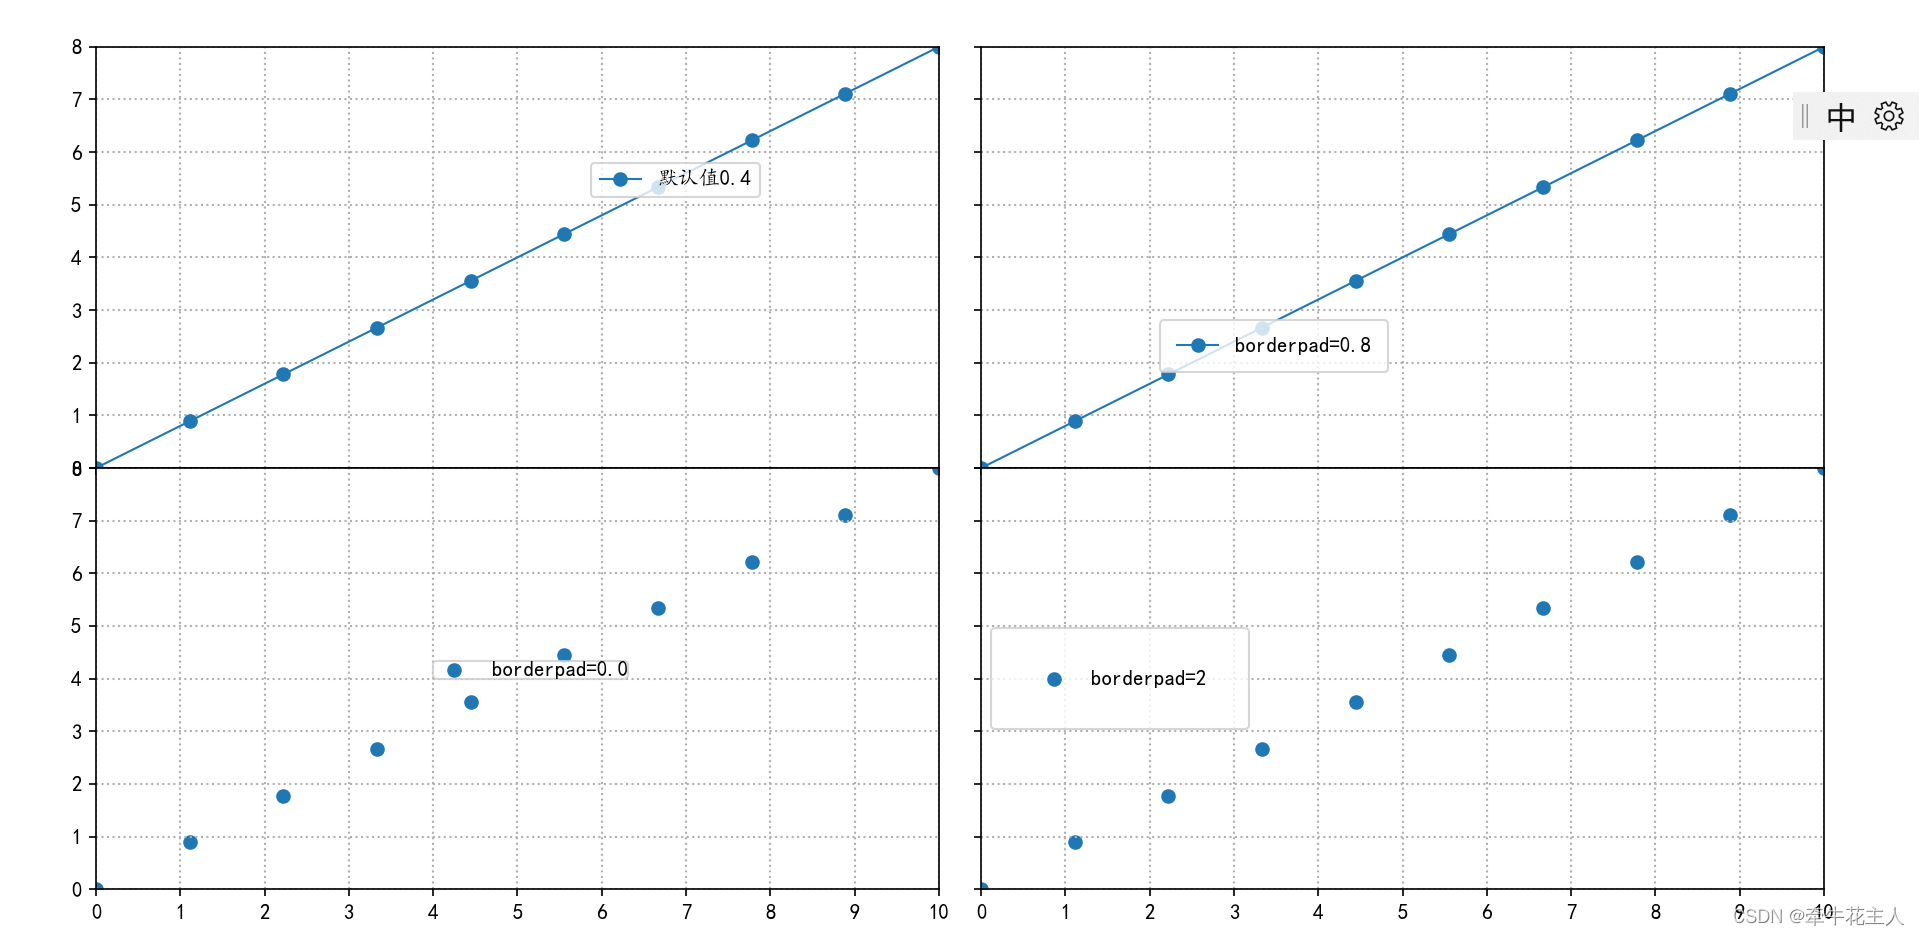
3.11 参数 borderpad
| 参数 | 含义 |
|---|---|
| loc | 字符串或反应相对位置的浮点型数据组成的坐标数据; |
| bbox_to_anchor | 两个或四个浮点数的元组,与loc参数一起决定图例的展示位置 |
| ncols | 图例展示为几列,默认展示为1列,为兼容以前版本也可使用ncol,但不推荐 |
| fontsize | 图例的字体大小,整数或者字符串,取值为整数时,指定字体的大小(单位:磅);取值为字符串时,表示字体相对于默认字体(medium)的大小,字符串取值: {‘xx-small’, ‘x-small’, ‘small’, ‘medium’, ‘large’, ‘x-large’, ‘xx-large’} |
| labelcolor | 图例中文本颜色,默认为黑色,取值可以为单个字符串颜色或颜色列表 |
| prop | 图例的字体属性字典,当该参数存在时,fontsize参数指定的字体大小将不被使用 |
| numpoints | 绘制折线图时,图例中标记的数量,默认为1个,当绘制折线图标记时才能显示 |
| prop | 绘制散点图时,图例中标记的数量,默认为1个 |
| markerscale | 图例中的标记相对于图中的原始大小 |
| markerfirst | 布尔值,默认取值为True,表示图例中的标记放在标签左边;取值为False表示图例标记放在标签右边 |
| frameon | 布尔值,是否显示图例边框,默认取值为True:显示 |
| fancybox | 布尔值,是否绘制圆角边框,默认取值为True:显示 |
| shadow | 布尔值,是否显示图例的阴影效果,默认取值为False:不显示 |
| facecolor | 图例填充颜色,默认为白色 |
| edgecolor | 图例边界颜色,默认为白色 |
| mode | 取值为expand或None;当取值为expand时,图例将在水平方向扩展填充,填充到参考区域的最后边 |
| title | 图例标题,默认无标题 |
| title_fontproperties | 图例标题字体属性 |
| title_fontsize | 取值为整数或 {‘xx-small’, ‘x-small’, ‘small’, ‘medium’, ‘large’, ‘x-large’, ‘xx-large’};图例字体大小,若同时需要设置其他字体属性,使用title_fontproperties属性;fontsize与title_propertiies两个参数不用同时使用 |
| borderpad | 图例距离边界框的距离,默认为0.4 |
import matplotlib.pyplot as plt
import numpy as np
import matplotlib as mpl
import matplotlib.pyplot as plt

mpl.rcParams['font.sans-serif'] = ['KaiTi']
mpl.rcParams['axes.unicode_minus'] = False

x = np.linspace(0, 10, 10)
y1 = np.linspace(0, 8, 10)

fig, ax = plt.subplots(2, 2, sharex=True, sharey=True)
plt.subplots_adjust(left=0.05, right=0.95, top=0.95, bottom=0.05,
                    wspace=0.05, hspace=0)
ax[0, 0].plot(x, y1, marker='o', lw=1, label='默认值0.4')
ax[0, 0].legend(loc='upper right',bbox_to_anchor=(5 / 10, 4 / 8, 3 / 10, 2 / 8),
                borderpad=0.4
              )
ax[0, 0].grid(ls=':', lw=1)
ax[0, 0].set_ylim(0, 8)
ax[0, 0].set_xlim(0, 10)
ax[0, 0].set_xticks(ticks=np.arange(0, 11))

ax[0, 1].plot(x, y1, lw=1, marker='o', label='borderpad=0.8')
ax[0, 1].legend(loc='upper left', bbox_to_anchor=(2 / 10, 3 / 8),
                borderpad=0.8)
ax[0, 1].grid(ls=':', lw=1)

ax[1, 0].scatter(x, y1, lw=1, label='borderpad=0.0')
ax[1, 0].legend(loc=(4 / 10, 4 / 8), borderpad=0.0)
ax[1, 0].grid(ls=':', lw=1)

ax[1, 1].scatter(x, y1, lw=1, label='borderpad=2')
ax[1, 1].legend(loc='center left',borderpad=2 )
ax[1, 1].grid(ls=':', lw=1)


plt.show()
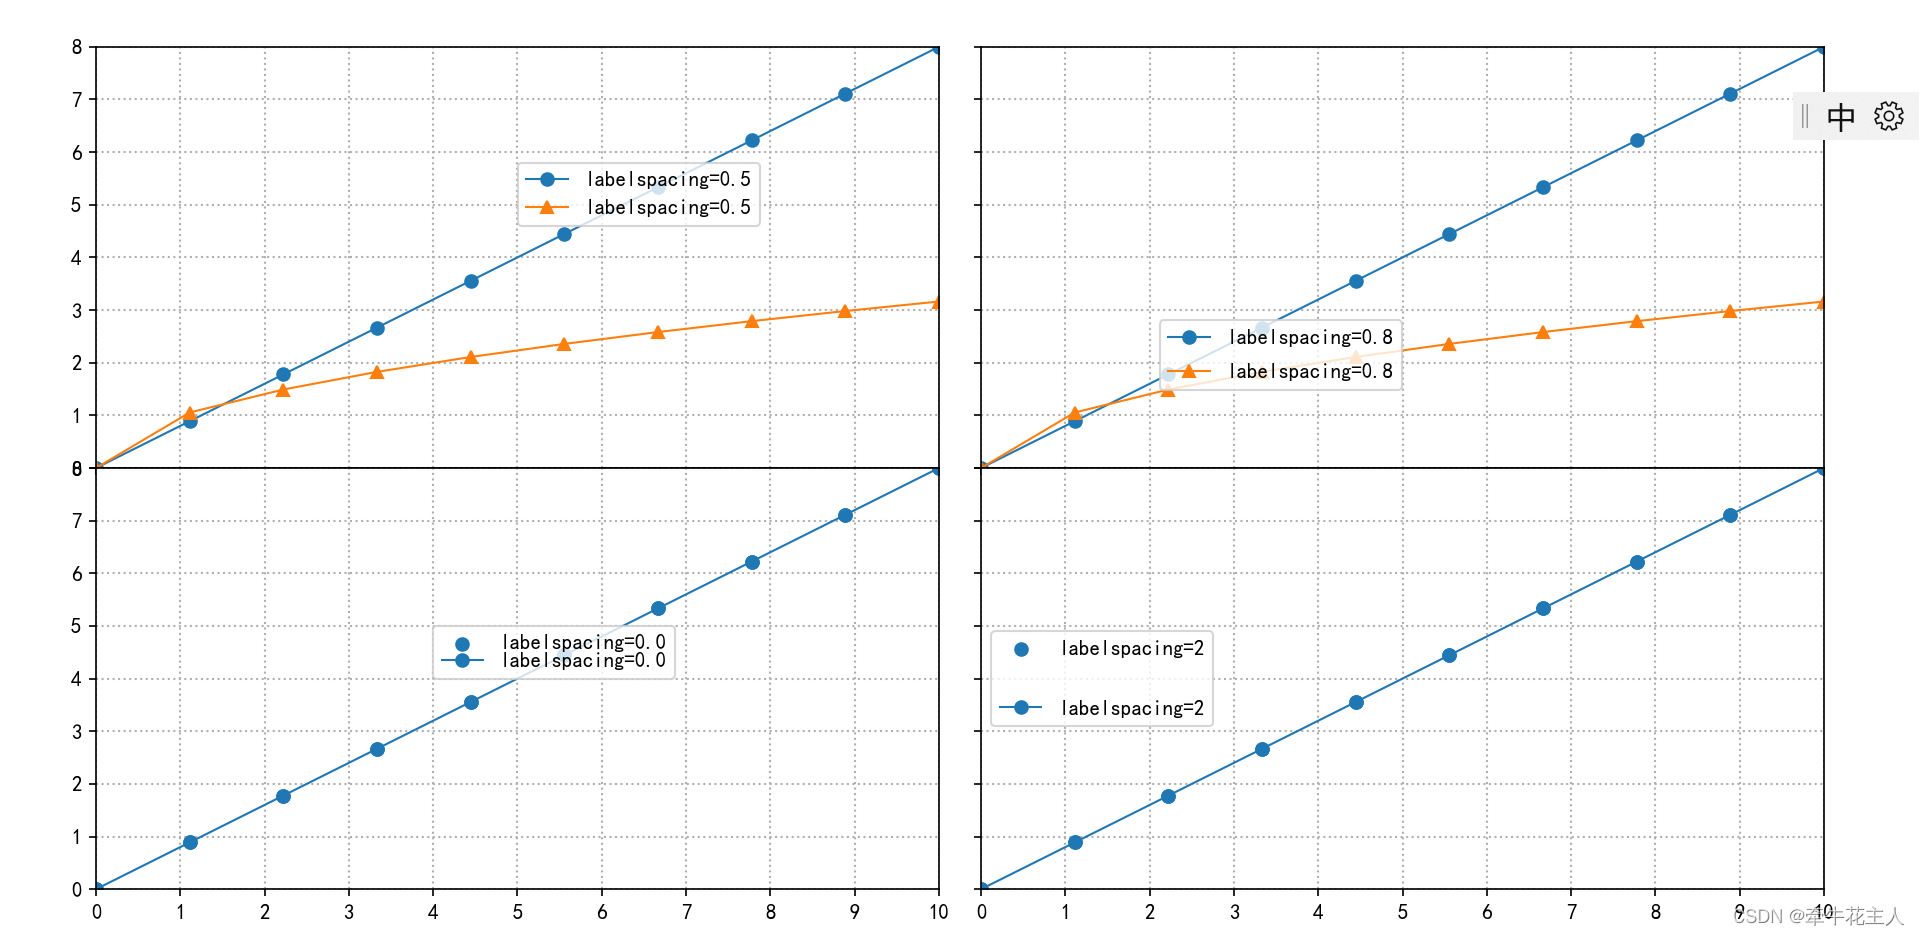
3.12 参数 labelspacing
| 参数 | 含义 |
|---|---|
| loc | 字符串或反应相对位置的浮点型数据组成的坐标数据; |
| bbox_to_anchor | 两个或四个浮点数的元组,与loc参数一起决定图例的展示位置 |
| ncols | 图例展示为几列,默认展示为1列,为兼容以前版本也可使用ncol,但不推荐 |
| fontsize | 图例的字体大小,整数或者字符串,取值为整数时,指定字体的大小(单位:磅);取值为字符串时,表示字体相对于默认字体(medium)的大小,字符串取值: {‘xx-small’, ‘x-small’, ‘small’, ‘medium’, ‘large’, ‘x-large’, ‘xx-large’} |
| labelcolor | 图例中文本颜色,默认为黑色,取值可以为单个字符串颜色或颜色列表 |
| prop | 图例的字体属性字典,当该参数存在时,fontsize参数指定的字体大小将不被使用 |
| numpoints | 绘制折线图时,图例中标记的数量,默认为1个,当绘制折线图标记时才能显示 |
| prop | 绘制散点图时,图例中标记的数量,默认为1个 |
| markerscale | 图例中的标记相对于图中的原始大小 |
| markerfirst | 布尔值,默认取值为True,表示图例中的标记放在标签左边;取值为False表示图例标记放在标签右边 |
| frameon | 布尔值,是否显示图例边框,默认取值为True:显示 |
| fancybox | 布尔值,是否绘制圆角边框,默认取值为True:显示 |
| shadow | 布尔值,是否显示图例的阴影效果,默认取值为False:不显示 |
| facecolor | 图例填充颜色,默认为白色 |
| edgecolor | 图例边界颜色,默认为白色 |
| mode | 取值为expand或None;当取值为expand时,图例将在水平方向扩展填充,填充到参考区域的最后边 |
| title | 图例标题,默认无标题 |
| title_fontproperties | 图例标题字体属性 |
| title_fontsize | 取值为整数或 {‘xx-small’, ‘x-small’, ‘small’, ‘medium’, ‘large’, ‘x-large’, ‘xx-large’};图例字体大小,若同时需要设置其他字体属性,使用title_fontproperties属性;fontsize与title_propertiies两个参数不用同时使用 |
| borderpad | 图例距离边界框的距离,默认为0.4 |
| lablespacing | 图例之间的垂直的距离,默认为0.4 |
import matplotlib.pyplot as plt
import numpy as np
import matplotlib as mpl
import matplotlib.pyplot as plt

mpl.rcParams['font.sans-serif'] = ['KaiTi']
mpl.rcParams['axes.unicode_minus'] = False

x = np.linspace(0, 10, 10)
y1 = np.linspace(0, 8, 10)
y2 = np.power(x,0.5)
fig, ax = plt.subplots(2, 2, sharex=True, sharey=True)
plt.subplots_adjust(left=0.05, right=0.95, top=0.95, bottom=0.05,
                    wspace=0.05, hspace=0)
ax[0, 0].plot(x, y1, marker='o', lw=1, label='labelspacing=0.5')
ax[0, 0].plot(x, y2, marker='^', lw=1, label='labelspacing=0.5')
ax[0, 0].legend(loc='upper right',bbox_to_anchor=(5 / 10, 4 / 8, 3 / 10, 2 / 8),
                labelspacing=0.5
              )
ax[0, 0].grid(ls=':', lw=1)
ax[0, 0].set_ylim(0, 8)
ax[0, 0].set_xlim(0, 10)
ax[0, 0].set_xticks(ticks=np.arange(0, 11))

ax[0, 1].plot(x, y1, lw=1, marker='o', label='labelspacing=0.8')
ax[0, 1].plot(x, y2, lw=1, marker='^', label='labelspacing=0.8')
ax[0, 1].legend(loc='upper left', bbox_to_anchor=(2 / 10, 3 / 8),
                labelspacing=0.8)
ax[0, 1].grid(ls=':', lw=1)

ax[1, 0].scatter(x, y1, lw=1, label='labelspacing=0.0')
ax[1, 0].plot(x, y1, lw=1, marker='o', label='labelspacing=0.0')
ax[1, 0].legend(loc=(4 / 10, 4 / 8), labelspacing=0.0)
ax[1, 0].grid(ls=':', lw=1)

ax[1, 1].scatter(x, y1, lw=1, label='labelspacing=2')
ax[1, 1].plot(x, y1, lw=1, marker='o', label='labelspacing=2')
ax[1, 1].legend(loc='center left',labelspacing=2 )
ax[1, 1].grid(ls=':', lw=1)


plt.show()
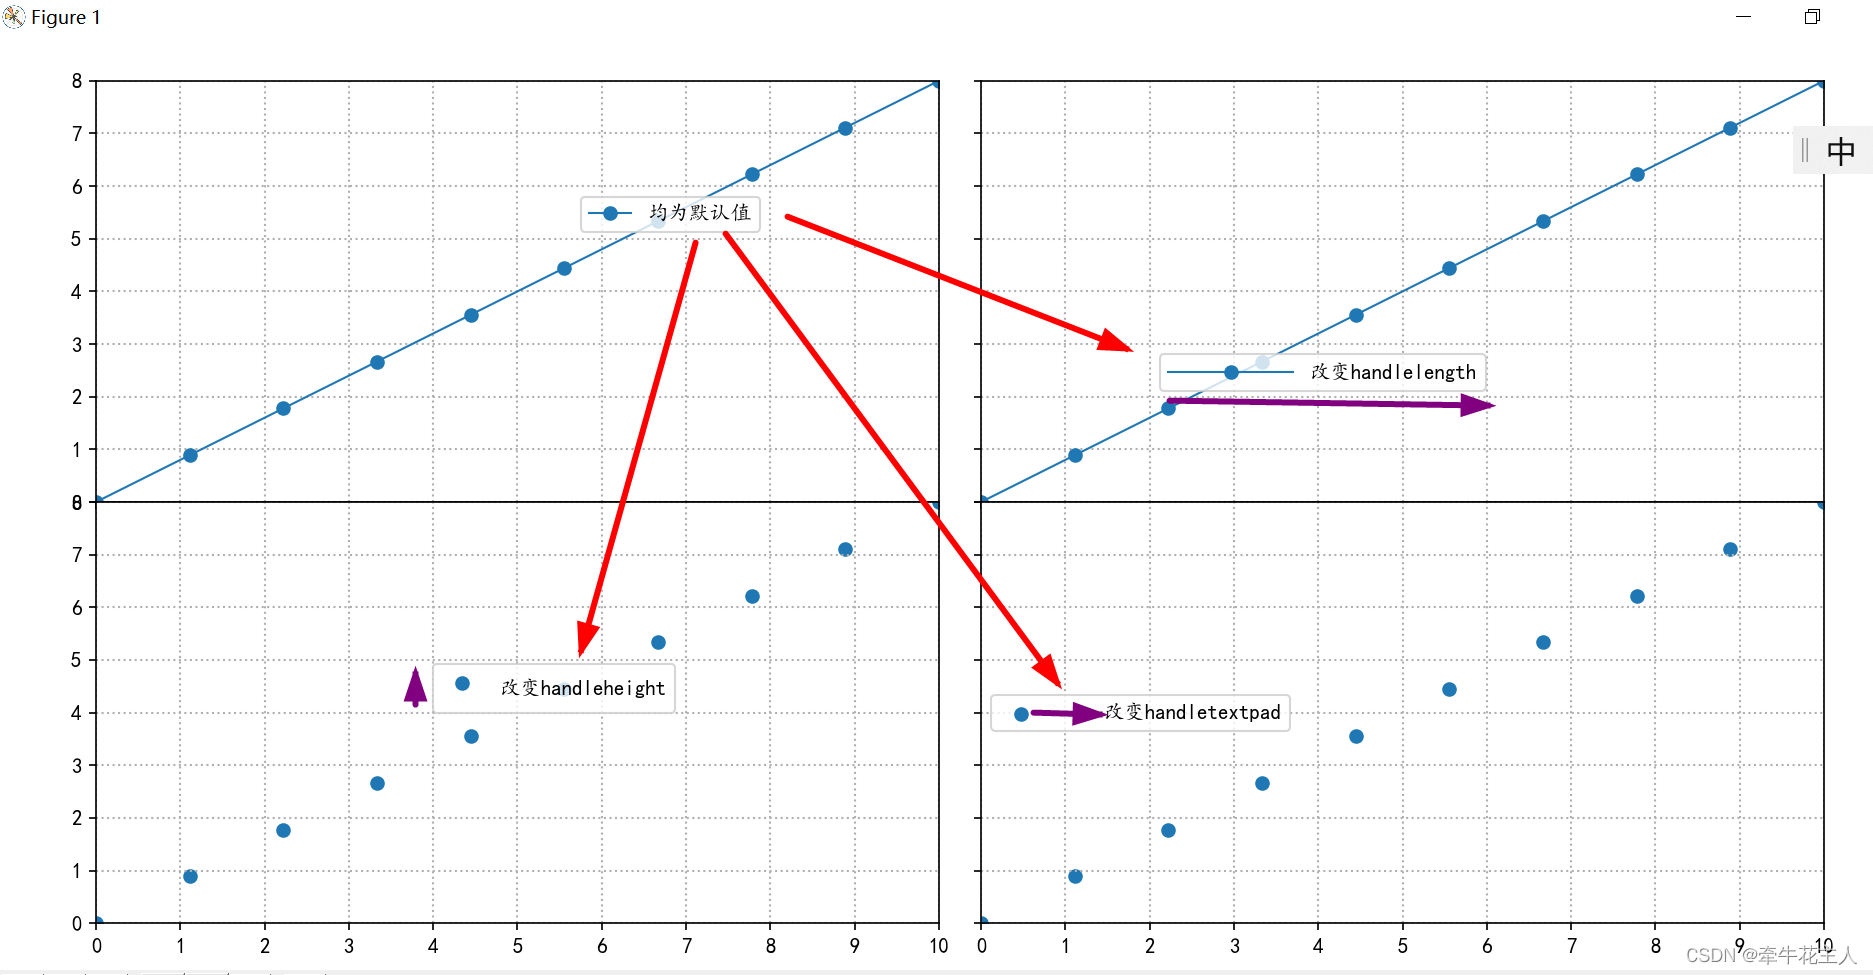
3.13 参数 handlelength、handleheight、handletextpad
| 参数 | 含义 |
|---|---|
| loc | 字符串或反应相对位置的浮点型数据组成的坐标数据; |
| bbox_to_anchor | 两个或四个浮点数的元组,与loc参数一起决定图例的展示位置 |
| ncols | 图例展示为几列,默认展示为1列,为兼容以前版本也可使用ncol,但不推荐 |
| fontsize | 图例的字体大小,整数或者字符串,取值为整数时,指定字体的大小(单位:磅);取值为字符串时,表示字体相对于默认字体(medium)的大小,字符串取值: {‘xx-small’, ‘x-small’, ‘small’, ‘medium’, ‘large’, ‘x-large’, ‘xx-large’} |
| labelcolor | 图例中文本颜色,默认为黑色,取值可以为单个字符串颜色或颜色列表 |
| prop | 图例的字体属性字典,当该参数存在时,fontsize参数指定的字体大小将不被使用 |
| numpoints | 绘制折线图时,图例中标记的数量,默认为1个,当绘制折线图标记时才能显示 |
| prop | 绘制散点图时,图例中标记的数量,默认为1个 |
| markerscale | 图例中的标记相对于图中的原始大小 |
| markerfirst | 布尔值,默认取值为True,表示图例中的标记放在标签左边;取值为False表示图例标记放在标签右边 |
| frameon | 布尔值,是否显示图例边框,默认取值为True:显示 |
| fancybox | 布尔值,是否绘制圆角边框,默认取值为True:显示 |
| shadow | 布尔值,是否显示图例的阴影效果,默认取值为False:不显示 |
| facecolor | 图例填充颜色,默认为白色 |
| edgecolor | 图例边界颜色,默认为白色 |
| mode | 取值为expand或None;当取值为expand时,图例将在水平方向扩展填充,填充到参考区域的最后边 |
| title | 图例标题,默认无标题 |
| title_fontproperties | 图例标题字体属性 |
| title_fontsize | 取值为整数或 {‘xx-small’, ‘x-small’, ‘small’, ‘medium’, ‘large’, ‘x-large’, ‘xx-large’};图例字体大小,若同时需要设置其他字体属性,使用title_fontproperties属性;fontsize与title_propertiies两个参数不用同时使用 |
| borderpad | 图例距离边界框的距离,默认为0.4 |
| lablespacing | 图例之间的垂直的距离,默认为0.4 |
| handlelength | 图例的长度,默认为2.0 |
| handlelheight | 图例的高度,默认为0.7 |
| handleltextpad | 图例与图例文本之间的空白距离,默认为0.8 |
import matplotlib.pyplot as plt
import numpy as np
import matplotlib as mpl
import matplotlib.pyplot as plt

mpl.rcParams['font.sans-serif'] = ['KaiTi']
mpl.rcParams['axes.unicode_minus'] = False

x = np.linspace(0, 10, 10)
y1 = np.linspace(0, 8, 10)
y2 = np.power(x,0.5)
fig, ax = plt.subplots(2, 2, sharex=True, sharey=True)
plt.subplots_adjust(left=0.05, right=0.95, top=0.95, bottom=0.05,
                    wspace=0.05, hspace=0)
ax[0, 0].plot(x, y1, marker='o', lw=1, label='均为默认值')
# ax[0, 0].plot(x, y2, marker='^', lw=1, label='labelspacing=0.5')
ax[0, 0].legend(loc='upper right',bbox_to_anchor=(5 / 10, 4 / 8, 3 / 10, 2 / 8),
                handlelength=2.0,handleheight=0.7,handletextpad=0.8,
              )
ax[0, 0].grid(ls=':', lw=1)
ax[0, 0].set_ylim(0, 8)
ax[0, 0].set_xlim(0, 10)
ax[0, 0].set_xticks(ticks=np.arange(0, 11))

ax[0, 1].plot(x, y1, lw=1, marker='o', label='改变handlelength')
# ax[0, 1].plot(x, y2, lw=1, marker='^', label='labelspacing=0.8')
ax[0, 1].legend(loc='upper left', bbox_to_anchor=(2 / 10, 3 / 8),
                handlelength=6.0,handleheight=0.7,handletextpad=0.8)
ax[0, 1].grid(ls=':', lw=1)

ax[1, 0].scatter(x, y1, lw=1, label='改变handleheight')
# ax[1, 0].plot(x, y1, lw=1, marker='o', label='labelspacing=0.0')
ax[1, 0].legend(loc=(4 / 10, 4 / 8), handlelength=2.0,handleheight=2,
                handletextpad=0.8)
ax[1, 0].grid(ls=':', lw=1)

ax[1, 1].scatter(x, y1, lw=1, label='改变handletextpad')
# ax[1, 1].plot(x, y1, lw=1, marker='o', label='labelspacing=2')
ax[1, 1].legend(loc='center left',handlelength=2.0,handleheight=0.7,
                handletextpad=3)
ax[1, 1].grid(ls=':', lw=1)


plt.show()
3.14 参数 borderaxespad、columnspacing
| 参数 | 含义 |
|---|---|
| loc | 字符串或反应相对位置的浮点型数据组成的坐标数据; |
| bbox_to_anchor | 两个或四个浮点数的元组,与loc参数一起决定图例的展示位置 |
| ncols | 图例展示为几列,默认展示为1列,为兼容以前版本也可使用ncol,但不推荐 |
| fontsize | 图例的字体大小,整数或者字符串,取值为整数时,指定字体的大小(单位:磅);取值为字符串时,表示字体相对于默认字体(medium)的大小,字符串取值: {‘xx-small’, ‘x-small’, ‘small’, ‘medium’, ‘large’, ‘x-large’, ‘xx-large’} |
| labelcolor | 图例中文本颜色,默认为黑色,取值可以为单个字符串颜色或颜色列表 |
| prop | 图例的字体属性字典,当该参数存在时,fontsize参数指定的字体大小将不被使用 |
| numpoints | 绘制折线图时,图例中标记的数量,默认为1个,当绘制折线图标记时才能显示 |
| prop | 绘制散点图时,图例中标记的数量,默认为1个 |
| markerscale | 图例中的标记相对于图中的原始大小 |
| markerfirst | 布尔值,默认取值为True,表示图例中的标记放在标签左边;取值为False表示图例标记放在标签右边 |
| frameon | 布尔值,是否显示图例边框,默认取值为True:显示 |
| fancybox | 布尔值,是否绘制圆角边框,默认取值为True:显示 |
| shadow | 布尔值,是否显示图例的阴影效果,默认取值为False:不显示 |
| facecolor | 图例填充颜色,默认为白色 |
| edgecolor | 图例边界颜色,默认为白色 |
| mode | 取值为expand或None;当取值为expand时,图例将在水平方向扩展填充,填充到参考区域的最后边 |
| title | 图例标题,默认无标题 |
| title_fontproperties | 图例标题字体属性 |
| title_fontsize | 取值为整数或 {‘xx-small’, ‘x-small’, ‘small’, ‘medium’, ‘large’, ‘x-large’, ‘xx-large’};图例字体大小,若同时需要设置其他字体属性,使用title_fontproperties属性;fontsize与title_propertiies两个参数不用同时使用 |
| borderpad | 图例距离边界框的距离,默认为0.4 |
| lablespacing | 图例之间的垂直的距离,默认为0.4 |
| handlelength | 图例的长度,默认为2.0 |
| handlelheight | 图例的高度,默认为0.7 |
| handleltextpad | 图例与图例文本之间的空白距离,默认为0.8 |
| borderaxespad | 图例边框与指定位置之间的距离,默认为0.5 |
| columnspacing | 图例列间距,默认为2.0 |
import matplotlib.pyplot as plt
import numpy as np
import matplotlib as mpl
import matplotlib.pyplot as plt

mpl.rcParams['font.sans-serif'] = ['KaiTi']
mpl.rcParams['axes.unicode_minus'] = False

x = np.linspace(0, 10, 10)
y1 = np.linspace(0, 8, 10)
y2 = np.power(x,0.5)
fig, ax = plt.subplots(2, 2, sharex=True, sharey=True)
plt.subplots_adjust(left=0.05, right=0.95, top=0.95, bottom=0.05,
                    wspace=0.05, hspace=0)
ax[0, 0].plot(x, y1, marker='o', lw=1, label='均为默认值')
ax[0, 0].plot(x, y2, marker='^', lw=1, label='均为默认值')
ax[0, 0].legend(loc='upper right',bbox_to_anchor=(5 / 10, 4 / 8, 3 / 10, 2 / 8),
               ncol=2, borderaxespad=0.5,columnspacing=2.0,
              )
ax[0, 0].grid(ls=':', lw=1)
ax[0, 0].set_ylim(0, 8)
ax[0, 0].set_xlim(0, 10)
ax[0, 0].set_xticks(ticks=np.arange(0, 11))

ax[0, 1].plot(x, y1, lw=1, marker='o', label='改变borderaxespad')
ax[0, 1].plot(x, y2, lw=1, marker='^', label='改变lborderaxespad')
ax[0, 1].legend(loc='upper left', bbox_to_anchor=(2 / 10, 3 / 8),ncol=2,
                borderaxespad=2, columnspacing=2.0)
ax[0, 1].grid(ls=':', lw=1)

ax[1, 0].scatter(x, y1, lw=1, label='改变columnspacing')
ax[1, 0].plot(x, y1, lw=1, marker='o', label='改变columnspacing')
ax[1, 0].legend(loc='center left',ncol=2,
                borderaxespad=0.5,columnspacing=6.0,
                )
ax[1, 0].grid(ls=':', lw=1)

ax[1, 1].scatter(x, y1, lw=1, label='borderaxespad=0.0')
ax[1, 1].plot(x, y1, lw=1, marker='o', label='borderaxespad=0.0')
ax[1, 1].legend(loc='upper right',bbox_to_anchor=(5 / 10, 4 / 8, 3 / 10, 2 / 8),
                ncol=2, borderaxespad=0.0,
                columnspacing=2.0,)
ax[1, 1].grid(ls=':', lw=1)


plt.show()

官方文档: plt.legend()函数


 3516
3516

 被折叠的 条评论
为什么被折叠?
被折叠的 条评论
为什么被折叠?
 到【灌水乐园】发言


