


The R package ‘brainGraph’ is much convenient to compute graph indicators than GRETNA, but no one compare the results between them.
Here is the comparison test between them, and the results show that their computations are equal.
gretna (weighted)
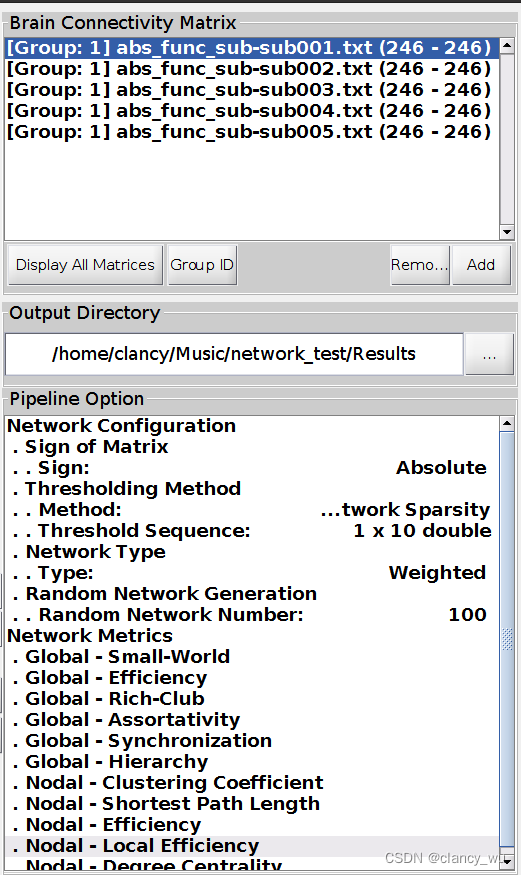
gretna (binary)

brainGraph code

Results comparison (network global efficiency as example)
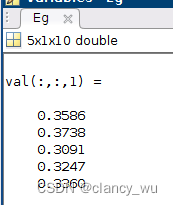
gretna (weighted)
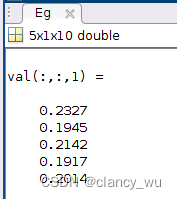
gretna (binary)
brainGraph
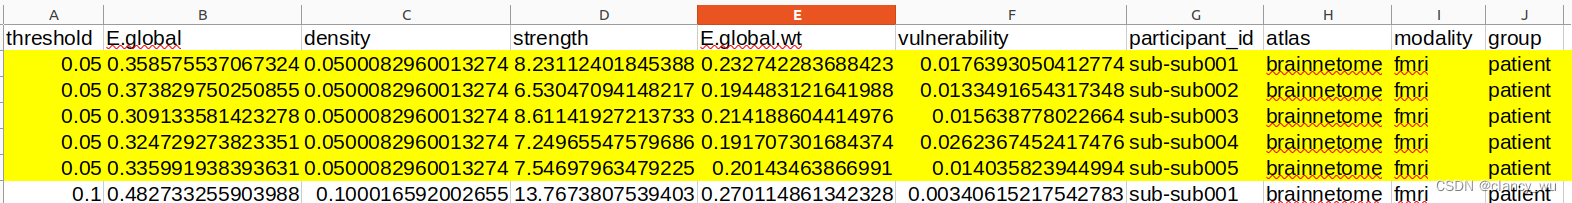
Conclusion
(1) Density in brainGraph = Network Sparsity in GRETNA = rate threshold (contrast with fixed threshold)
(2) Results of brainGraph are same to GRETNA
(3) In brainGraph, the indicator with ‘wt’ represents ‘weighted’ and without ‘wt’ represents ‘binary’
(4) I recommend to use brainGraph rather than GRETNA


 1万+
1万+


 被折叠的 条评论
为什么被折叠?
被折叠的 条评论
为什么被折叠?
 到【灌水乐园】发言


