excel箱形图中位数
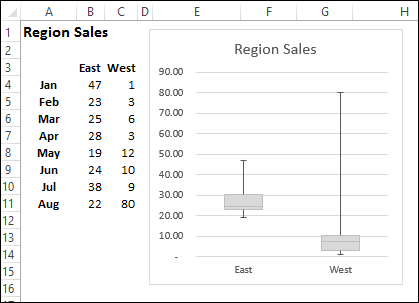
A box plot (box and whisker chart) lets you show how numbers are distributed in a set of data. Excel doesn’t have a built-in chart type for a box plot, but you can create a simple box plot in Excel, using a stacked column chart, and error bars.
箱形图(箱形图和晶须图)使您可以显示数字在一组数据中的分布方式。 Excel没有箱形图的内置图表类型,但是您可以使用堆叠的柱状图和误差线在Excel中创建简单的箱形图。
Excel中的简单箱形图 (Simple Box Plot in Excel)
做计算 (Do the Calculations)
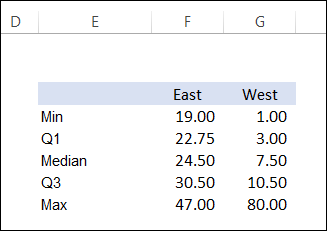
To build a box plot, you’ll need to do a few calculations for each set of data: Min, Quartile 1, Median, Quartile 3, and Max.
要构建箱形图,您需要对每组数据进行一些计算:最小值,四分位数1,中位数,四分位数3和最大值。
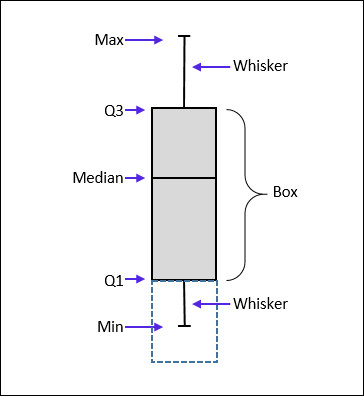
From those calculations, you can figure out the height of each box, and the length of the whiskers. The diagram below shows where each measure appears in the box plot.
通过这些计算,您可以算出每个盒子的高度和晶须的长度。 下图显示了每个度量在箱形图中的显示位置。
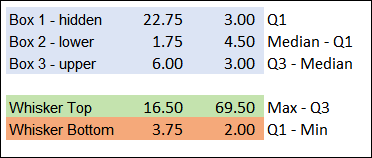
Just subtract the bottom measure from the top one, to get the height/length. For example, the upper box height is Quartile 3 minus the Median.
只需从顶部测量值中减去底部测量值,即可获得高度/长度。 例如,上框的高度为四分位数3减去中位数。
建立图表 (Build the Chart)
Once you have the box and whisker measurements, you can build a stacked column chart from the box measurements, and hide the first box, by removing its fill colour.
一旦获得了箱形和晶须尺寸,就可以从箱形度量中构建堆叠的柱状图,并通过删除其填充色来隐藏第一个框。
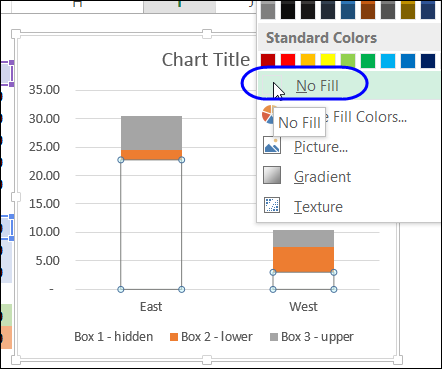
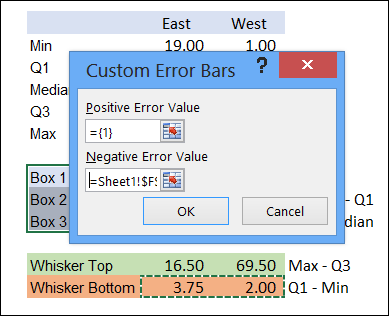
For the whiskers, create a positive error bar in the upper box, and a negative error bar in the hidden box, using the values that you calculated.
对于晶须,使用计算出的值在上方的框中创建一个正误差条,在隐藏的框中创建一个负误差条。
详细信息和下载 (Details and Download)
To get the details on these steps, and to download the sample file, you can visit the Create a Box Plot page on my Contextures website. The steps are also shown in the video at the end of this article.
若要获取有关这些步骤的详细信息并下载示例文件,可以访问我的Contextures网站上的“ 创建箱形图”页面。 这些步骤也显示在本文结尾的视频中。
使用Excel Charting Utility快速构建 (Quick Build with the Excel Charting Utility)
This example is a very simple box plot, with no frills. If you need to create something more complex, and need it done quickly, you can invest in the Peltier Tech Charting Utility. It lets you create a Box Plot, Waterfall, or other complex charts with just a few clicks.
这个例子是一个非常简单的箱形图,没有多余的装饰。 如果您需要创建更复杂的东西并且需要快速完成,则可以投资Peltier Tech Charting Utility 。 它使您只需单击几下即可创建箱形图,瀑布图或其他复杂图表。
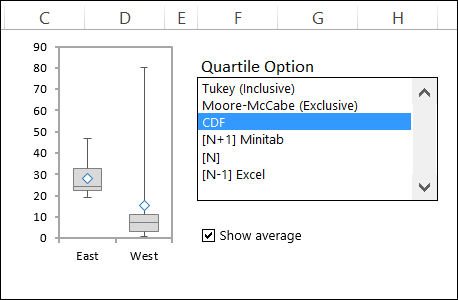
Here’s the box plot that I created using the charting utility – it has an average marker, and several options for the quartile calculations. All I had to do was select a cell in my data, and click a couple of chart layout options. You can see how the utility works in this video that I recorded.
这是我使用制图工具创建的箱形图–它具有一个平均标记,以及用于四分位数计算的几个选项。 我要做的就是在数据中选择一个单元格,然后单击几个图表布局选项。 您可以在我录制的视频中看到该实用程序的工作方式。
视频:构建简单的箱形图 (Video: Build a Simple Box Plot)
To see the steps for building a simple box plot, from a stacked column chart and error bars, please watch this short video tutorial.
要从堆叠的柱状图和误差线查看构建简单箱形图的步骤,请观看此简短视频教程。
翻译自: https://contexturesblog.com/archives/2013/06/11/create-a-simple-box-plot-in-excel/
excel箱形图中位数


 这篇博客介绍了如何在Excel中创建简单的箱形图,虽然Excel没有内置的箱形图图表类型,但可以通过堆叠柱状图和误差线来实现。首先需要计算每组数据的最小值、四分位数1、中位数、四分位数3和最大值,然后根据这些计算结果构建图表。文章提供了详细的步骤和视频教程,还提到了Peltier Tech Charting Utility作为快速创建复杂箱形图的工具。


 430
430

 被折叠的 条评论
为什么被折叠?


