


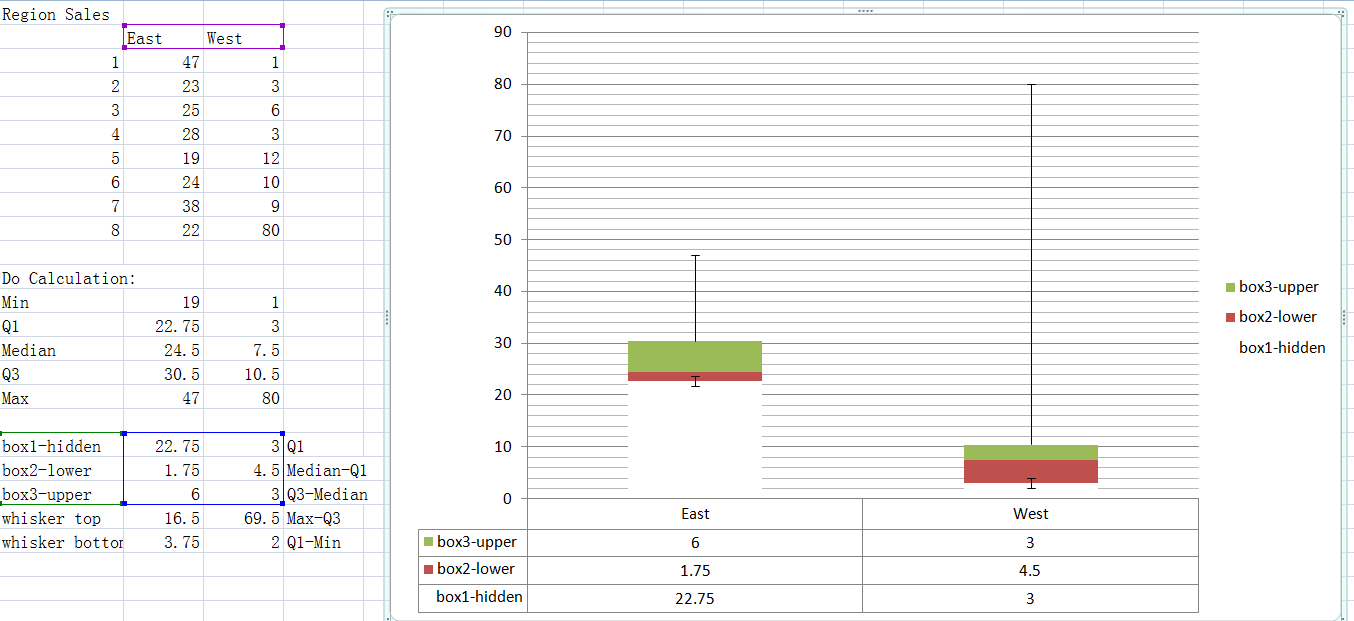
- 首先在Excel中输入你想话Box plot的数据;
| - | West | East |
|---|---|---|
| 1 | 47 | 1 |
| 2 | 23 | 3 |
| 3 | 25 | 6 |
| 4 | 28 | 3 |
| 5 | 19 | 12 |
| 5 | 24 | 10 |
| 6 | 38 | 9 |
| 7 | 22 | 80 |
2.然后计算需要的值:
| Min | 19 | 1 | |
| Q1 | 22.75 | 3 | |
| Median | 24.5 | 7.5 | |
| Q3 | 30.5 | 10.5 | |
| Max | 47 | 80 | |
| box1-hidden | 22.75 | 3 | Q1 |
| box2-lower | 1.75 | 4.5 | Median-Q1 |
| box3-upper | 6 | 3 | Q3-Median |
| whisker top | 16.5 | 69.5 | Max-Q3 |
| whisker bottom | 3.75 | 2 | Q1-Min |
3. 选择B2:C2和A19:C21,然后Insert–>Column(In Charts group)–>Stacked Column,插入一个stacked的chart,如果x轴和y轴不对的话,可以通过Design–>Switch Row/Column交换xy轴;
4. 选中stacked column中的最下面的一个series,将它的背景色去掉,也可以将gridline去掉;
5. 关键的一步是用ErrorBar生成Box plot的upper whisker和lower whisker;选择最下面的一个series,在Layout–>Analysis–>Error Bar–>More Error Bars Options–>Custom–>选择whiker bottom一行的两个数据。就可以了。
http://blog.contextures.com/archives/2013/06/11/create-a-simple-box-plot-in-excel/
http://peltiertech.com/excel-box-and-whisker-diagrams-box-plots/


 3084
3084

 被折叠的 条评论
为什么被折叠?
被折叠的 条评论
为什么被折叠?
 到【灌水乐园】发言


