


🎋开发平台:jupyter lab
🎠编程语言:python3.x
社区网络算法之GN算法
1. GN算法的简介
GN算法:一个经典的社区发现算法,它属于分裂的层次聚类算法。最初,由Michelle Girvan和Mark Newman提出。
其基本思想:不断的删除网络中具有相对于所有源节点的最大的边介数的边,然后,再重新计算网络中剩余的边的相对于所有源节点的边介数,重复这个过程,直到网络中,所有边都被删除。
1.1 GN算法涉及的概念
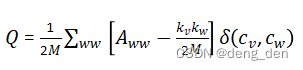
(1)模块度Q,也称模块化度量值,是评价社区的结构强度的指标。指标结果越大,社区划分效果越好。
- 模块度的计算公式如下:
其中Q是模块度,M是网络中边的数量。综上,GN算法的整体流程如图2.1所示。(2)边介数(Betweenness):网络中经过每条边的最短路径的数目。
1.2 GN算法实现的步骤
- 计算网络中所有边的介数;
- 找到介数最高的边并将它从网络中移除;
- n 重复,直到每个节点就是一个社团为止;
2. GN的实现及其可视化
- 算法结构:
2.1 数据文件(data.txt)
1 2
1 3
2 3
4 5
4 6
5 6
9 10
9 11
10 11
12 13
12 14
13 14
3 7
6 7
7 8
8 9
8 12
8 15
15 16
16 17
15 17
2.2 GN算法实现
- 工具类方法
#util.py文件
#coding=utf-8
import networkx as nx
import random

# 加载网络
def load_graph(path):
   G = nx.Graph()
   with open(path) as text:
       for line in text:
           vertices = line.strip().split(" ")
           source = int(vertices[0])
           target = int(vertices[1])
           G.add_edge(source, target)
   return G

# 克隆
def clone_graph(G):
   cloned_graph = nx.Graph()
   for edge in G.edges():
       cloned_graph.add_edge(edge[0], edge[1])
   return cloned_graph

# 计算Q值
def cal_Q(partition, G):
   m = len(list(G.edges()))  #边的个数
   a = []
   e = []

   # 计算每个社区的a值
   for community in partition:
       t = 0
       for node in community:
           t += len(list(G.neighbors(node)))
       a.append(t / float(2 * m))

   # 计算每个社区的e值
   for community in partition:
       t = 0
       for i in range(len(community)):
           for j in range(len(community)):
               if i != j:
                   if G.has_edge(community[i], community[j]):
                       t += 1
       e.append(t / float(2 * m))

   # 计算Q
   q = 0
   for ei, ai in zip(e, a):
       q += (ei - ai ** 2)
   return q

##获取随机颜色
colors = []
def get_color():
   global colors #声明我们在函数内部使用的是在函数外部定义的全局变量a
   colorArr = ['1','2','3','4','5','6','7','8','9','A','B','C','D','E','F']
   color = ""
   for i in range(6):
       color += colorArr[random.randint(0,14)]
   if color in colors:
       color = get_color()
       ###防止陷入死循环,设置颜色数组最大长度
       if len(colors)==50:
           colors = []
   else:
       colors.append(color)
   return color
- GN算法类及其主函数
#GN.py文件
# coding=utf-8
# 首先导入包
import networkx as nx
import matplotlib.pyplot as plt
class GN(object):
"""docstring for GN"""
def __init__(self, G):
self._G_cloned = clone_graph(G)
self._G = G
self._partition = [[n for n in G.nodes()]]
self._max_Q = 0.0
# GN算法
def execute(self):
while len(self._G.edges()) > 0:
# 1.计算所有边的edge betweenness
edge = max(nx.edge_betweenness(self._G).items(),
key=lambda item: item[1])[0]
# 2.移去edge betweenness最大的边
self._G.remove_edge(edge[0], edge[1])
# 获得移去边后的子连通图
components = [list(c) for c in list(nx.connected_components(self._G))]
if len(components) != len(self._partition):
# 3.计算Q值
cur_Q = cal_Q(components, self._G_cloned)
# print(cur_Q)
if cur_Q > self._max_Q:
self._max_Q = cur_Q
self._partition = components
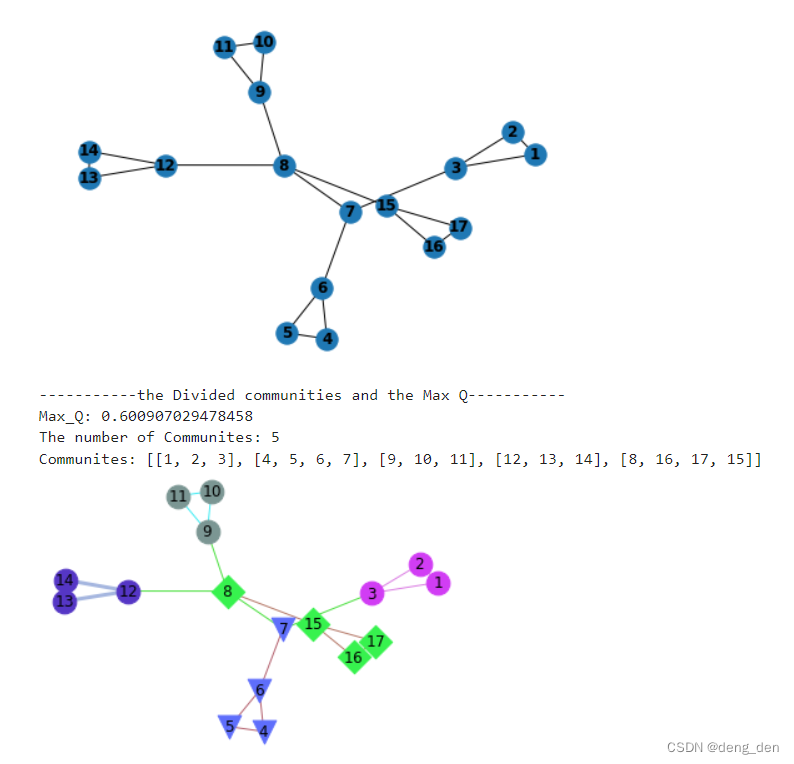
print('-----------the Divided communities and the Max Q-----------')
print('Max_Q:', self._max_Q)
print('The number of Communites:', len(self._partition))
print("Communites:", self._partition)
return self._partition
# 可视化划分结果
def showCommunity(G, partition, pos):
# 划分在同一个社区的用一个符号表示,不同社区之间的边用黑色粗体
cluster = {}
labels = {}
for index, item in enumerate(partition):
for nodeID in item:
labels[nodeID] = r'$' + str(nodeID) + '$' # 设置可视化label
cluster[nodeID] = index # 节点分区号
# 可视化节点
# colors = ['r', 'g', 'b', 'y', 'm']
shapes = ['v', 'D', 'o', '^', '<']
### [217, 13, 14]
for index, item in enumerate(partition):
nx.draw_networkx_nodes(G, pos, nodelist=item,
node_color="#"+get_color(),
node_shape=shapes[random.randint(0,102)%4],
node_size=350,
alpha=1)
# 可视化边
edges = {len(partition): []}
for link in G.edges():
# cluster间的link
if cluster[link[0]] != cluster[link[1]]:
edges[len(partition)].append(link)
else:
# cluster内的link
if cluster[link[0]] not in edges:
edges[cluster[link[0]]] = [link]
else:
edges[cluster[link[0]]].append(link)
for index, edgelist in enumerate(edges.values()):
# cluster内
if index < len(partition):
nx.draw_networkx_edges(G, pos,
edgelist=edgelist,
width=1, alpha=0.8, edge_color="#"+get_color())
else:
# cluster间
nx.draw_networkx_edges(G, pos,
edgelist=edgelist,
width=3, alpha=0.8, edge_color="#"+get_color())
# 可视化label
nx.draw_networkx_labels(G, pos, labels, font_size=12)
plt.axis('off')
plt.show()
if __name__ == '__main__':
# 加载网络数据并可视化
G = load_graph("./data.txt")
pos = nx.spring_layout(G)
nx.draw(G, pos, with_labels=True, font_weight='bold')
plt.show()
# GN算法
algo = GN(G)
partition = algo.execute()
#print(partition)
# 可视化结果
showCommunity(algo._G_cloned, partition, pos)
2.3 运行结果
3.参考文章
(1)【复杂网络社团发现】GN算法步骤详解(附python代码实现).
(2) 【复杂网络社区发现】社区网络算法之GN算法.
(3) 【复杂网络社团发现】Gephi绘制网络图.
(4) 【复杂网络社团发现】GN算法边介数详解.


 2929
2929


 被折叠的 条评论
为什么被折叠?
被折叠的 条评论
为什么被折叠?
 到【灌水乐园】发言


