


GBD数据库前沿分析(Frontier analysis)的主要目的是评估某种负担与社会人口发展之间的关系,特别是通过社会人口指数(SDI)来识别不同国家或地区在降低疾病负担方面的潜在改进空间。
通过使用前沿分析,研究确定了基于SDI的最低可实现的年龄标准化DALYs(伤残调整生命年)率,为政策制定和资源分配提供科学依据。统计方法如数据包络分析、自举样本和LOESS回归被用于计算实际值与前沿值之间的差异,并考虑不确定性,从而帮助识别优化资源配置和改善健康结果的机会。
接下来我们将使用GlobalburdenR工具中函数实现数据的前沿分析
1.首先我们去加载数据
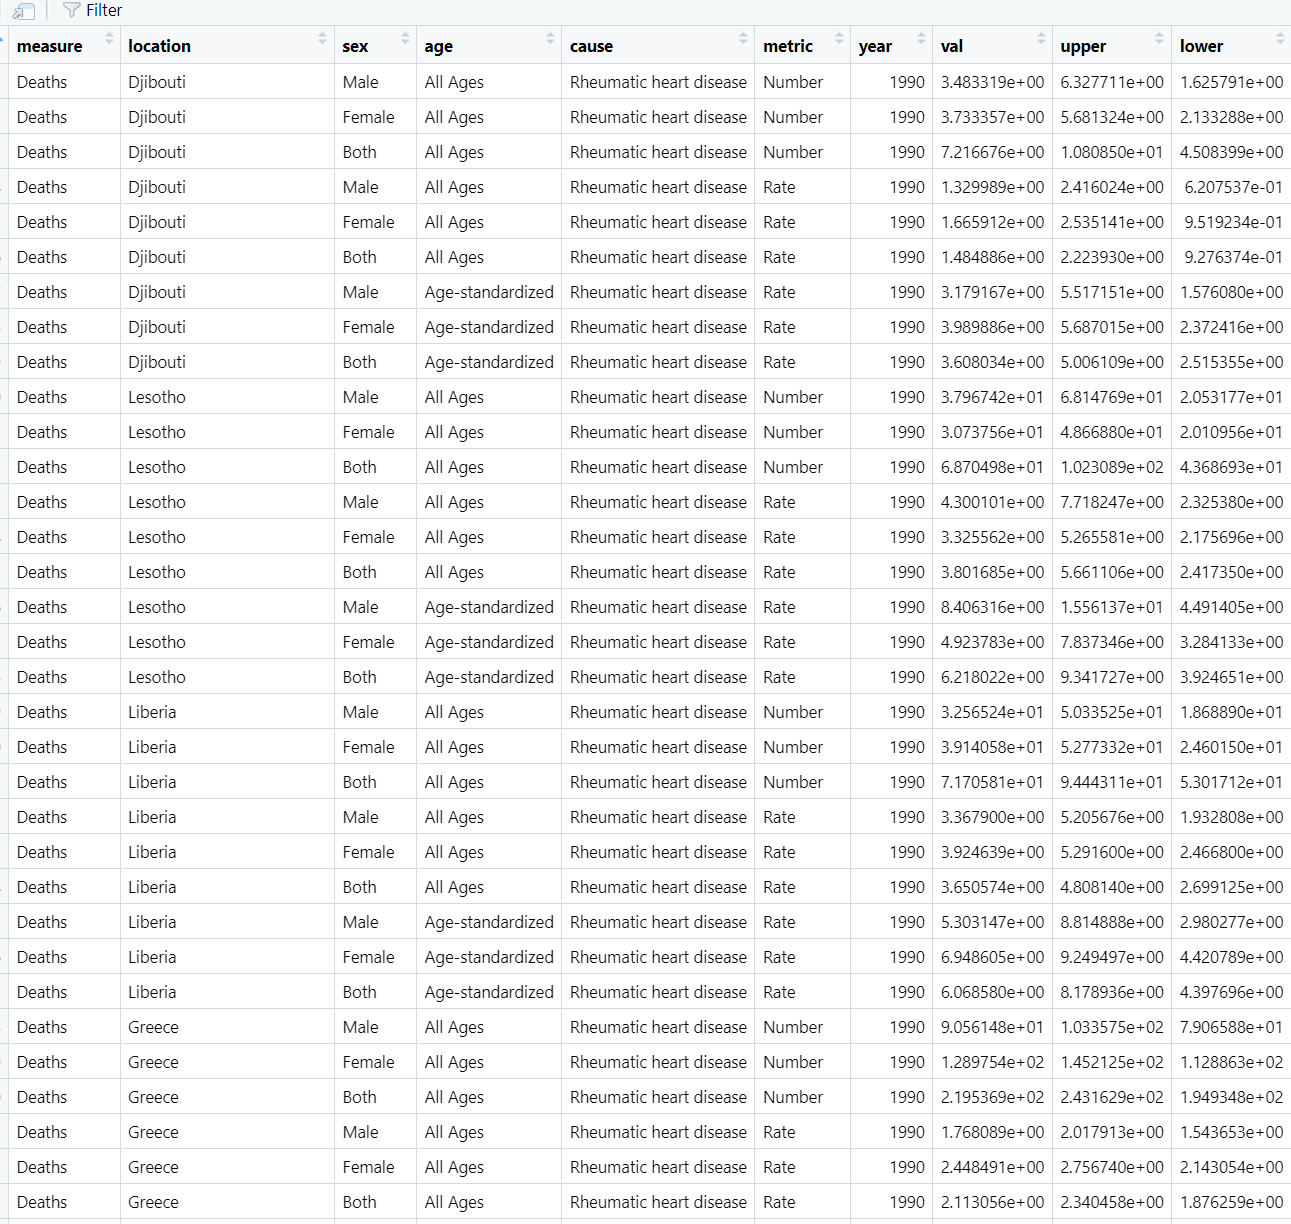
# 加载必要的包library(dplyr)library(data.table)library(purrr)library(tidyr)library(ggplot2)library(ggrepel)library(dplyr)library(progress)setwd('X:/GBD数据库示例数据/')# 读取数据case <- read.csv('frontier.csv', header = T)
data('SDI2021')#SDI数据results <- frontier_analysis(case, SDI,year1 = 1990, # 第一个年份year2 = 2019, # 第二个年份age = 'Age-standardized',metric = 'Rate',sex = 'Both',measure = 'DALYs (Disability-Adjusted Life Years)')# 提取结果data <- result[[1]] # 所有年份的完整数据data_1990 <- result[[2]] # 1990 年的数据data_2019 <- result[[3]]# 2019 年的数据data_2019$trend <- ifelse(data_2019$ASR > data_1990$ASR, "Increase", "Decrease")# 绘图res = plot_frontier(data, data_2019)res$plotAres$plotB
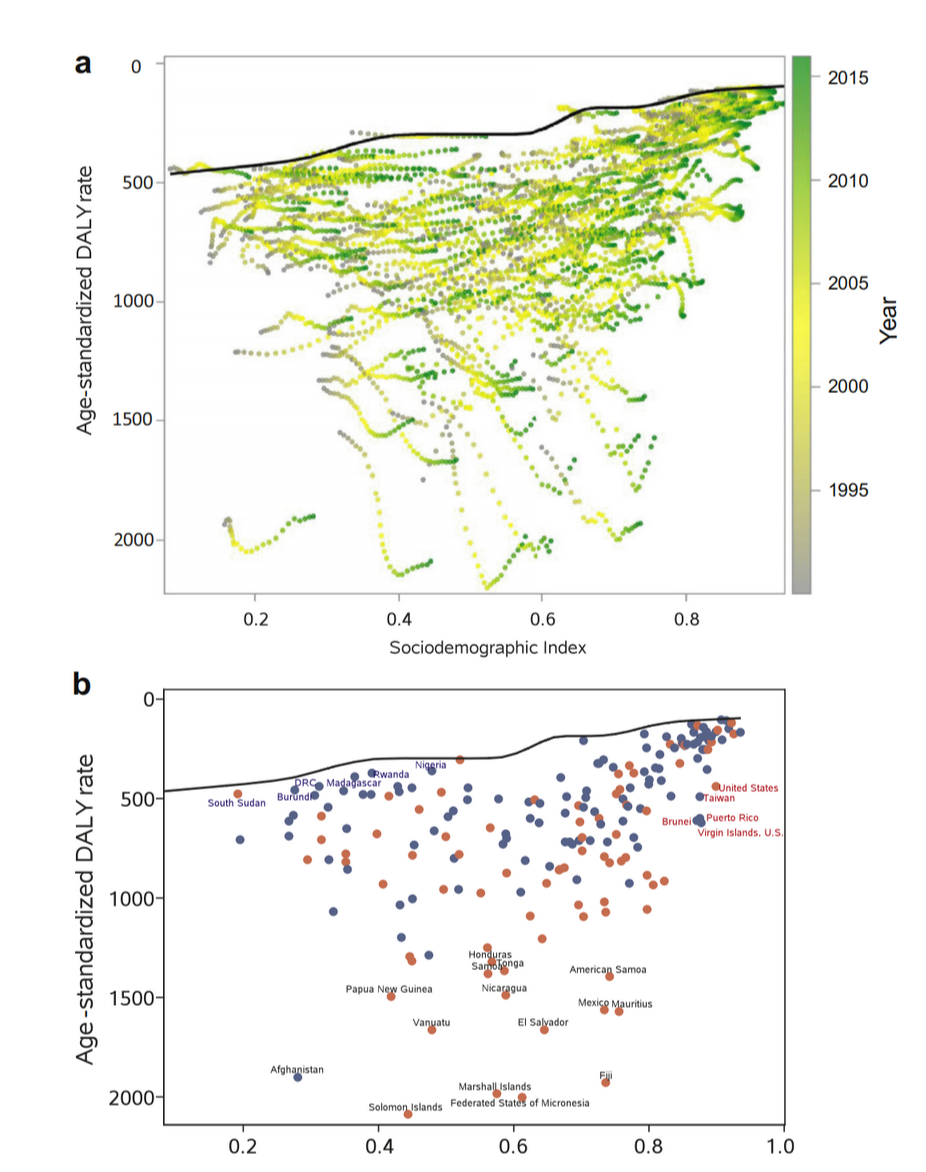
其中的曲线就是前沿线,点是不同的国家,X轴是SDI,Y轴是标准化率,离前沿线越近证明该地区或者国家对于疾病的控制较好,如果距离越远证明对于疾病的控制还有很多进步空间。


 713
713

 被折叠的 条评论
为什么被折叠?
被折叠的 条评论
为什么被折叠?
 到【灌水乐园】发言


