


前文中股票高相关k线筛选问题的延伸。基于github上的代码迁移应用到股票高相关预测上。
这里给出一个相对完整的代码实现。
1、数据准备
准备股票的历史k线数据。数据格式: 股票名称、日期、收盘价。
1.1 数据处理和格式转换
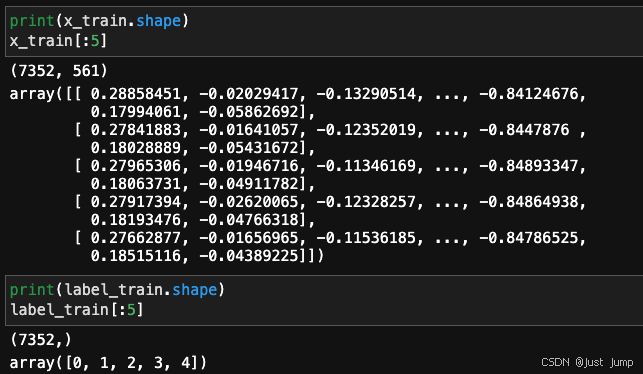
这里我们使用DTW算法来做股票K线的相似性查找,所以是允许时间不一致的。所以,我们会对股票收盘价数据做一个处理,将每支股票的收盘价读取成一个numpy.array,shape为(561,)所以股票的收盘价数据作为x_train,shape为 (7352, 561)。将股票名称读取成numpy.array,shape为(7352,)。
# Import dataset
x_train_file = open('data/train/X_train.txt', 'r')
# Create empty lists
x_train = []
# Loop through datasets
for x in x_train_file:
    x_train.append([float(ts) for ts in x.split()])

# Convert to numpy for efficiency
x_train = np.array(x_train)
label_train=np.arange(7352)
即数据格式处理为:
1.2 绘制k-线图查看
假设 ta=x_train[0] 是你当前在研究的股票。
我们随机抽取其他几支股票,将目标股票和其它股票的k-线图绘图看下,如下
plt.figure(figsize=(11,7))
colors = ['#E52008','#2C9F2C','#FD7F23','#1F77B4','#0467BD',
          '#80564A','#7F7F7F','#1FBECF','#E377C2','#BCBD27']

for i, r in enumerate([0,27,65,100,145,172]):
    plt.subplot(3,2,i+1)
    plt.plot(x_train[r][:100], label="stock-%d"%label_train[r], color=colors[i], linewidth=2)
    plt.xlabel('time sequece')$
    plt.legend(loc='upper left')
    plt.tight_layout()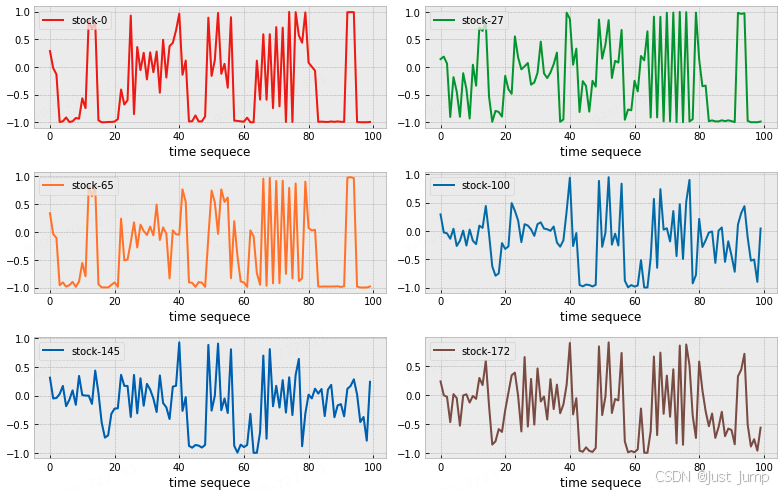
接下来要基于dtw距离计算与目标股票ta高相关的Top10支股票,并将他们的k-线图与ta股票的k-线图进行可视化对比呈现。
2、dtw算法模型
2.1、dtw算法
import sys
import collections
import itertools
import numpy as np
import matplotlib.pyplot as plt
from scipy.stats import mode
from scipy.spatial.distance import squareform

plt.style.use('bmh')
%matplotlib inline

try:
    from IPython.display import clear_output
    have_ipython = True
except ImportError:
    have_ipython = False

class dtw(object):
    """K-nearest neighbor classifier using dynamic time warping
    as the distance measure between pairs of time series arrays

    Arguments
    ---------
    n_neighbors : int, optional (default = 5)
        Number of neighbors to use by default for KNN

    max_warping_window : int, optional (default = infinity)
        Maximum warping window allowed by the DTW dynamic
        programming function

    subsample_step : int, optional (default = 1)
        Step size for the timeseries array. By setting subsample_step = 2,
        the timeseries length will be reduced by 50% because every second
        item is skipped. Implemented by x[:, ::subsample_step]
    """

    def __init__(self, n_neighbors=5, max_warping_window=10000, subsample_step=1):
        self.n_neighbors = n_neighbors
        self.max_warping_window = max_warping_window
        self.subsample_step = subsample_step

    def _dtw_distance(self, ts_a, ts_b, d = lambda x,y: abs(x-y)):
        """Returns the DTW similarity distance between two 2-D
        timeseries numpy arrays.

        Arguments
        ---------
        ts_a, ts_b : array of shape [n_samples, n_timepoints]
            Two arrays containing n_samples of timeseries data
            whose DTW distance between each sample of A and B
            will be compared

        d : DistanceMetric object (default = abs(x-y))
            the distance measure used for A_i - B_j in the
            DTW dynamic programming function

        Returns
        -------
        DTW distance between A and B
        """

        # Create cost matrix via broadcasting with large int
        ts_a, ts_b = np.array(ts_a), np.array(ts_b)
        M, N = len(ts_a), len(ts_b)
        cost = sys.maxsize * np.ones((M, N))

        # Initialize the first row and column
        cost[0, 0] = d(ts_a[0], ts_b[0])
        for i in np.arange(1, M):
            cost[i, 0] = cost[i-1, 0] + d(ts_a[i], ts_b[0])

        for j in np.arange(1, N):
            cost[0, j] = cost[0, j-1] + d(ts_a[0], ts_b[j])

        # Populate rest of cost matrix within window
        for i in np.arange(1, M):
            for j in np.arange(max(1, i - self.max_warping_window),
                            min(N, i + self.max_warping_window)):
                choices = cost[i - 1, j - 1], cost[i, j-1], cost[i-1, j]
                cost[i, j] = min(choices) + d(ts_a[i], ts_b[j])

        # Return DTW distance given window
        return cost[-1, -1]

    def _dist_matrix(self, x, y):
        """Computes the M x N distance matrix between the training
        dataset and testing dataset (y) using the DTW distance measure

        Arguments
        ---------
        x : array of shape [n_samples, n_timepoints]

        y : array of shape [n_samples, n_timepoints]

        Returns
        -------
        Distance matrix between each item of x and y with
            shape [training_n_samples, testing_n_samples]
        """

        # Compute the distance matrix
        dm_count = 0

        # Compute condensed distance matrix (upper triangle) of pairwise dtw distances
        # when x and y are the same array
        if(np.array_equal(x, y)):
            x_s = np.shape(x)
            dm = np.zeros((x_s[0] * (x_s[0] - 1)) // 2, dtype=np.double)

            p = ProgressBar(shape(dm)[0])

            for i in np.arange(0, x_s[0] - 1):
                for j in np.arange(i + 1, x_s[0]):
                    dm[dm_count] = self._dtw_distance(x[i, ::self.subsample_step],
                                                      y[j, ::self.subsample_step])

                    dm_count += 1
                    p.animate(dm_count)

            # Convert to squareform
            dm = squareform(dm)
            return dm

        # Compute full distance matrix of dtw distnces between x and y
        else:
            x_s = np.shape(x)
            y_s = np.shape(y)
            dm = np.zeros((x_s[0], y_s[0]))
            dm_size = x_s[0]*y_s[0]

            p = ProgressBar(dm_size)

            for i in np.arange(0, x_s[0]):
                for j in np.arange(0, y_s[0]):
                    dm[i, j] = self._dtw_distance(x[i, ::self.subsample_step],
                                                  y[j, ::self.subsample_step])
                    # Update progress bar
                    dm_count += 1
                    p.animate(dm_count)

            return dm

    def fit(self, x, l):
        """Fit the model using x as training data and l as class labels

        Arguments
        ---------
        x : array of shape [n_samples, n_timepoints]
            Training data set for input into KNN classifer

        l : array of shape [n_samples]
            Training labels for input into KNN classifier
        """

        self.x = x
        self.l = l

    def predict(self, x):
        """Predict the class labels or probability estimates for
        the provided data

        Arguments
        ---------
          x : array of shape [n_samples, n_timepoints]
              Array containing the testing data set to be classified

        Returns
        -------
          2 arrays representing:
              (1) the predicted class labels
              (2) the knn label count probability
        """

        dm = self._dist_matrix(x, self.x)

        # Identify the k nearest neighbors
        knn_idx = dm.argsort()[:, :self.n_neighbors]

        # Identify k nearest labels
        knn_labels = self.l[knn_idx]

        # Model Label
        mode_data = mode(knn_labels, axis=1)
        mode_label = mode_data[0]
        mode_proba = mode_data[1]/self.n_neighbors

#         return knn_labels,dm.ravel()[knn_idx]
        return knn_idx, knn_labels, dm.ravel()[knn_idx]

class ProgressBar:
    """This progress bar was taken from PYMC
    """
    def __init__(self, iterations):
        self.iterations = iterations
        self.prog_bar = '[]'
        self.fill_char = '*'
        self.width = 40
        self.__update_amount(0)
        if have_ipython:
            self.animate = self.animate_ipython
        else:
            self.animate = self.animate_noipython

    def animate_ipython(self, iter):
#         print('\r', self,)
#         sys.stdout.flush()
        self.update_iteration(iter + 1)

    def update_iteration(self, elapsed_iter):
        self.__update_amount((elapsed_iter / float(self.iterations)) * 100.0)
        self.prog_bar += '  %d of %s complete' % (elapsed_iter, self.iterations)

    def __update_amount(self, new_amount):
        percent_done = int(round((new_amount / 100.0) * 100.0))
        all_full = self.width - 2
        num_hashes = int(round((percent_done / 100.0) * all_full))
        self.prog_bar = '[' + self.fill_char * num_hashes + ' ' * (all_full - num_hashes) + ']'
        pct_place = (len(self.prog_bar) // 2) - len(str(percent_done))
        pct_string = '%d%%' % percent_done
        self.prog_bar = self.prog_bar[0:pct_place] + \
            (pct_string + self.prog_bar[pct_place + len(pct_string):])

    def __str__(self):
        return str(self.prog_bar)
3、为目标股票ta筛选Top10高相似的股票
3.1 模型调用,喂入股票K-线数据
n_neighbors = 10
dtw_model = dtw(n_neighbors=n_neighbors, max_warping_window=10)
m =dtw_model.fit(x_train,label_train)
3.2 查找目标股票TopN高相似
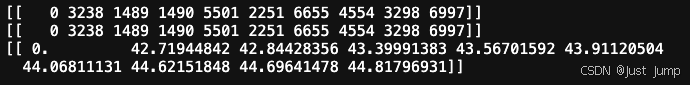
# 计算1支股票x_train[0]的TopN高相似,需要做reshape转换
knn_idx, knn_labels, dtm_dist = dtw_model.predict(x_train[0].reshape(1,561))
print(knn_idx)
print(knn_labels)
print(dtm_dist)

# 计算多支股票的TopN高相似,多维数据无需转换了
knn_idx, knn_labels, dtm_dist = dtw_model.predict(x_train[1:5])
3.3 打印高相关股票并绘图可视化
plt.figure(figsize=(20, 6))
print("\nstock-0的高相似Top%d支股票为:"%(n_neighbors))
print("股票名称  dtw距离")
for j,stock_id in enumerate(knn_labels.ravel()):
    print(stock_id,' ',dtm_dist.ravel()[j])
    plt.subplot(2,5,j+1)
    plt.plot(x_train[0][:100], label="stock-0", color=(0.9,0.1,0.1), linewidth=2)
    plt.plot(x_train[stock_id][:100], label="stock-%d"%stock_id, color=(0.2,0.1,0.7), linewidth=2)
    plt.xlabel('time')
    plt.legend(loc='upper left')
    plt.tight_layout()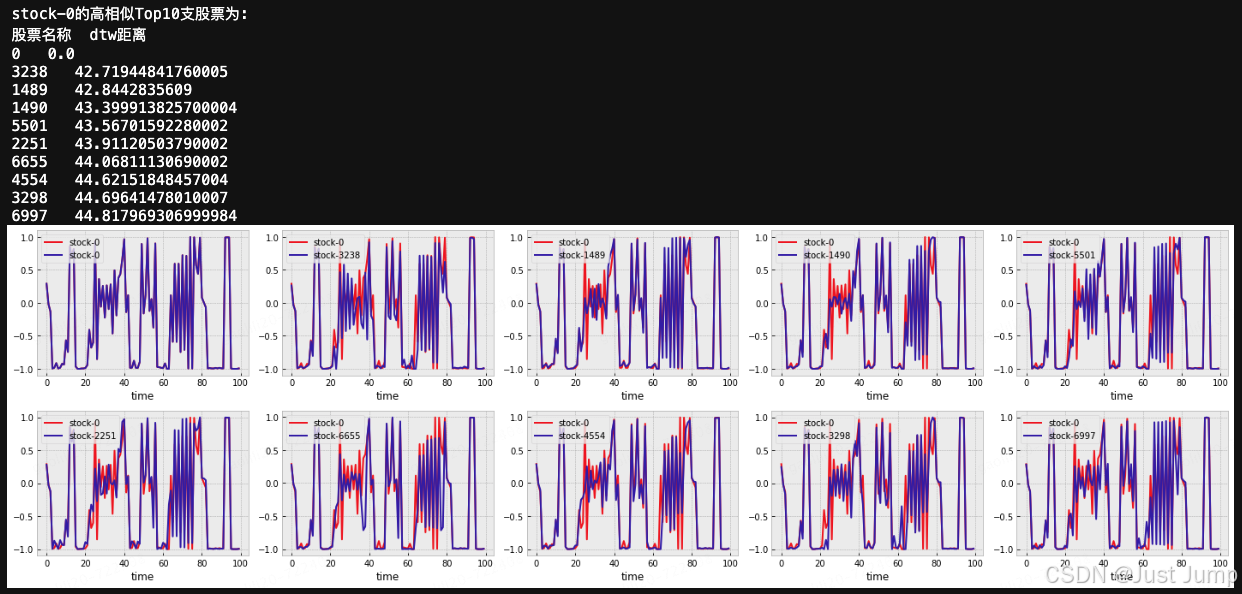
红色的是目标股票Ta的k-线图,与之高相似的10支股票的k-线图为蓝色曲线,分别呈现在10个子图中,对股票的走势差异做对比,方便投资者查看股票走势做出判断。
可以看出TopN高相似中第一个被查出来的是目标股票本身,当然可以在predict方法中优化下去掉本身这个结果。
到此就完成了给股票高相关K-线图的查找和可视化。
代码在我电脑本地是跑通的。
Done


 669
669

 被折叠的 条评论
为什么被折叠?
被折叠的 条评论
为什么被折叠?
 到【灌水乐园】发言


