


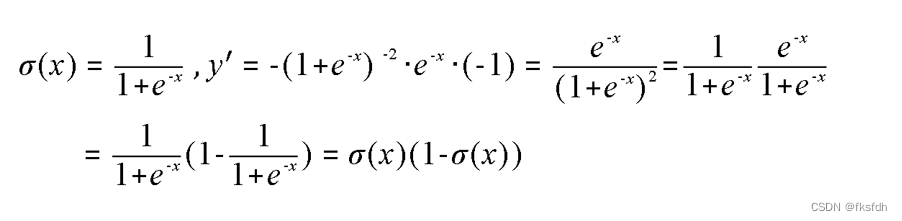
公式:
代码:
import math
import numpy as np
import matplotlib.pyplot as plt

def sigmoid(x):

    e1 = 1 + pow(math.e,-(x))
    e2 = pow(e1,-1)
    return e2

#导数
def d_sigmoid(x):

    e = sigmoid(x) * (1 - sigmoid(x))
    return e


x_ = np.arange(-10,10,0.0001)
print(x_)
y = [sigmoid(x_[i]) for i in range(len(x_))]
dy = [d_sigmoid(x_[i]) for i in range(len(x_))]


plt.plot()
#构建折线图,可以设置线宽,颜色属性
plt.plot(x_,y,color = 'r',linewidth=1.0,linestyle='--')
plt.plot(x_,dy,color = 'g',linewidth=1.0,linestyle='--')


plt.title("sigmoid")
plt.ylabel("y") #设置y轴名称,
plt.xlabel("x") #设置x轴名称

plt.show()


 2321
2321


 被折叠的 条评论
为什么被折叠?
被折叠的 条评论
为什么被折叠?
 到【灌水乐园】发言


