


Linear Regression
Key takeaways
-
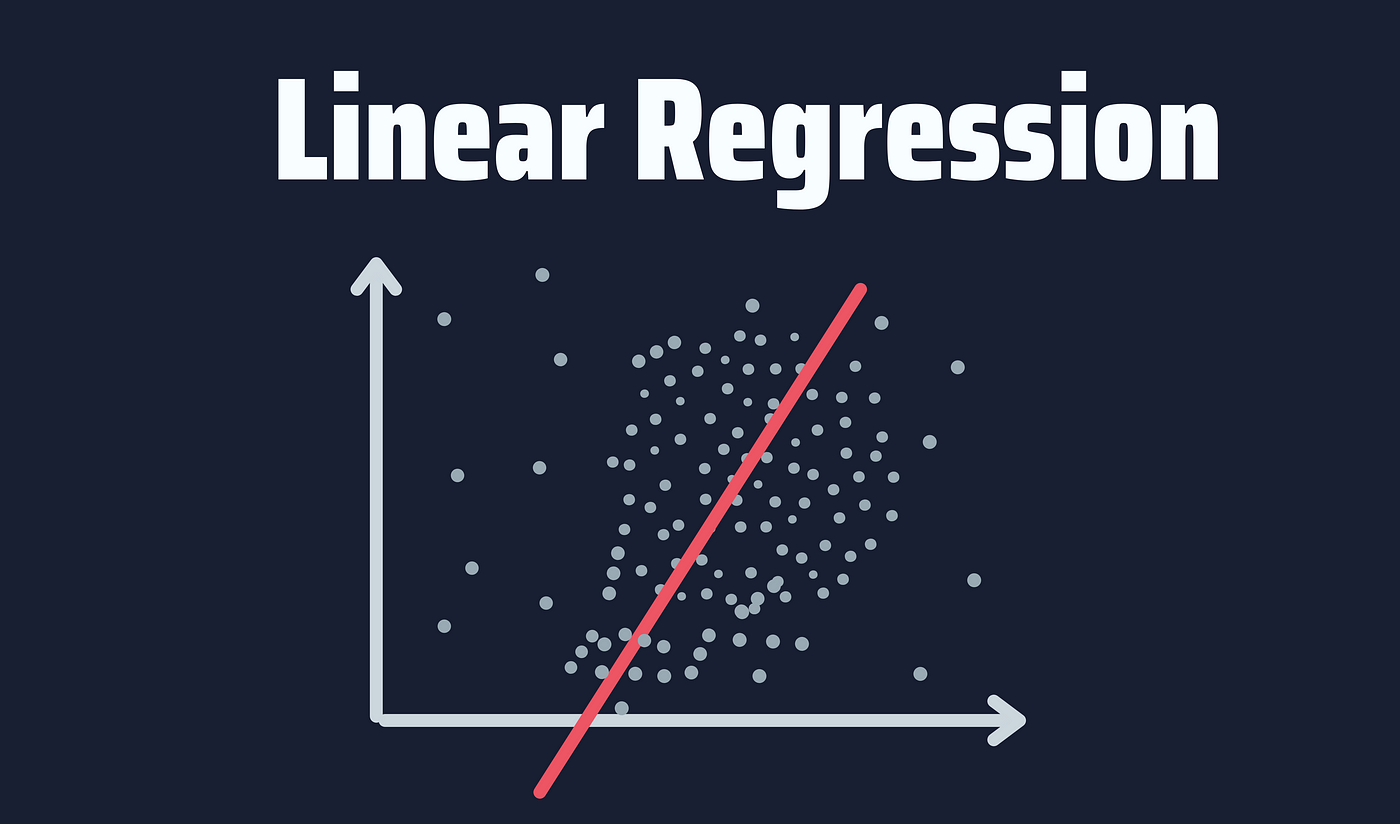
Linear regression aims to find the best-fit line that describes the relationship between two variables. -
The equation of a straight line is , where y is the dependent variable, x is the independent variable, m is the slope of the line, and b is the y-intercept. -
The slope of the line represents the change in y for every one-unit change in x. -
Linear regression can be used for both simple regression (one independent variable) and multiple regression (multiple independent variables). -
The quality of the fit can be measured using the R-squared value, which represents the proportion of the variance in the dependent variable that is explained by the independent variable(s). -
The assumptions of linear regression include linearity, independence, homoscedasticity, and normality. -
Linear regression can be used for prediction, inference, and hypothesis testing. -
Linear regression can be extended to more complex models, such as polynomial regression, logistic regression, and generalized linear models.
Interview Questions
-
What is linear regression? -
What is the difference between simple linear regression and multiple linear regression? -
What are the assumptions of linear regression? -
What is the purpose of the intercept in a linear regression model? -
What is the coefficient of determination (R-squared)? -
What is the difference between correlation and regression? -
How do you handle multicollinearity in linear regression? -
What is the impact of outliers on linear regression? -
How do you determine the significance of a regression coefficient? -
What are some common challenges with linear regression? -
What are some alternatives to linear regression? -
How do you validate a linear regression model? -
Can linear regression be used for classification problems? -
How do you interpret the results of a linear regression analysis? -
How would you explain linear regression to a non-technical person?
Solutions
What is linear regression?
Linear regression is a statistical method used to model the relationship between a dependent variable and one or more independent variables. It assumes that the relationship between the variables is linear and tries to find the best-fit line that describes the relationship between them.
What is the difference between simple linear regression and multiple linear regression?
Simple linear regression involves one independent variable and one dependent variable, whereas multiple linear regression involves two or more independent variables and one dependent variable.
What are the assumptions of linear regression?
The assumptions of linear regression include linearity, independence of errors, normality of errors, equal variance of errors, and absence of multicollinearity.
What is the purpose of the intercept in a linear regression model?
The intercept represents the predicted value of the dependent variable when all independent variables are equal to zero.
What is the coefficient of determination (R-squared)?
The coefficient of determination (R-squared) is a measure of how well the regression line fits the data. It represents the proportion of the variation in the dependent variable that is explained by the independent variables.
What is the difference between correlation and regression?
Correlation measures the strength and direction of the relationship between two variables, while regression models the relationship between a dependent variable and one or more independent variables.
How do you handle multicollinearity in linear regression?
Multicollinearity can be handled by removing one of the correlated independent variables, combining them into a single variable, or using a different regression method that is not affected by multicollinearity, such as ridge regression.
What is the impact of outliers on linear regression?
Outliers can have a significant impact on the regression line and may affect the accuracy of the model. It's important to identify and address outliers in the data before building the regression model.
How do you determine the significance of a regression coefficient?
The significance of a regression coefficient can be determined by testing the null hypothesis that the coefficient is equal to zero. This is typically done using a t-test or F-test.
What are some common challenges with linear regression?
Some common challenges with linear regression include violations of the assumptions, multicollinearity, outliers, and overfitting.
What are some alternatives to linear regression?
Some alternatives to linear regression include logistic regression, Poisson regression, and survival analysis.
How do you validate a linear regression model?
A linear regression model can be validated by assessing its fit to the data using measures such as R-squared, adjusted R-squared, and residual plots. Cross-validation techniques can also be used to test the model's performance on new data.
Can linear regression be used for classification problems?
Linear regression is not typically used for classification problems, but it can be adapted to binary classification problems using logistic regression.
How do you interpret the results of a linear regression analysis?
The results of a linear regression analysis can be interpreted by examining the coefficients of the independent variables, their standard errors, and their p-values. These can be used to determine the significance of the variables and their impact on the dependent variable.
How would you explain linear regression to a non-technical person?
Linear regression is a statistical method used to model the relationship between two variables. It assumes that the relationship between the variables is linear and tries to find the best-fit line that describes the relationship between them. The equation of the line can be used to make predictions about the dependent variable based on the values of the independent variable.
Python Application
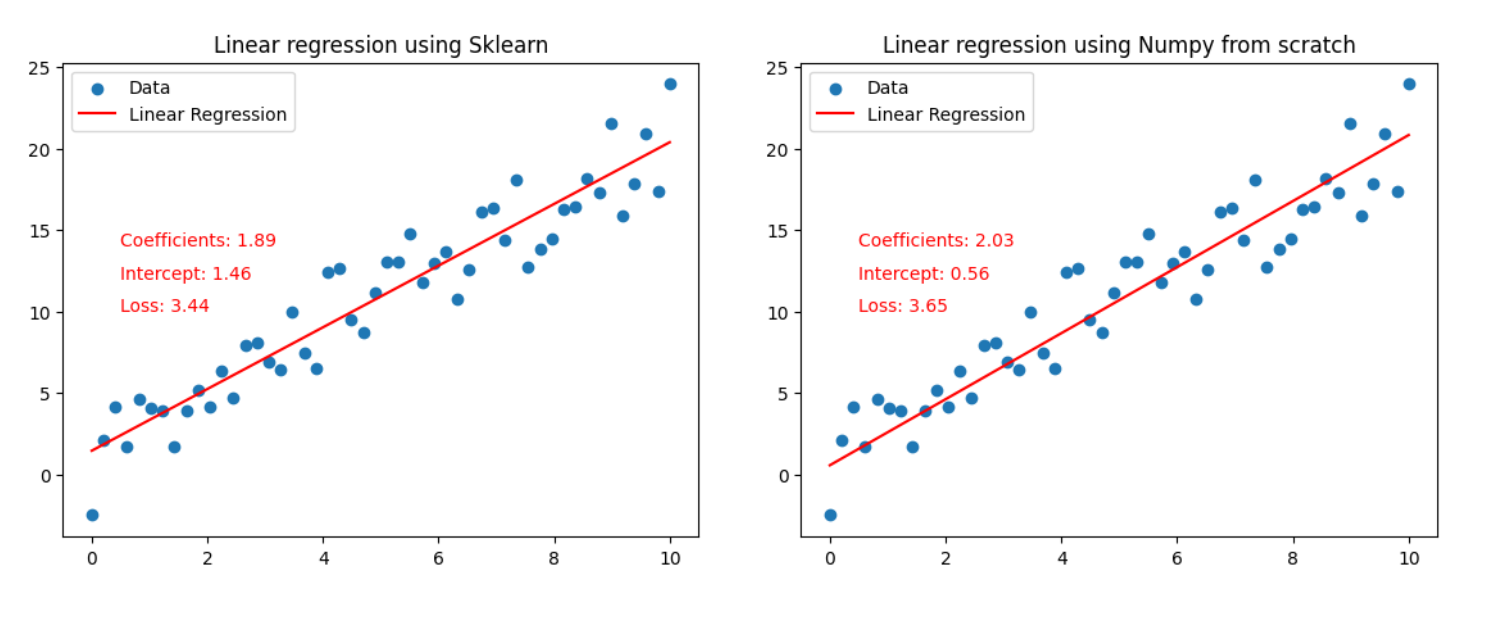
Using Sklearn
import numpy as np
from sklearn.linear_model import LinearRegression
import matplotlib.pyplot as plt

np.random.seed(100)

# 生成一维随机数据
x = np.linspace(0, 10, 50)
y = 2*x + 1 + np.random.normal(0, 2, 50)

# 创建LinearRegression实例并训练数据
model = LinearRegression()
model.fit(x.reshape(-1, 1), y)

# 计算预测值
y_pred = model.predict(x.reshape(-1, 1))

# 计算损失值
loss = np.mean((y - y_pred)**2)

# 绘制散点图和拟合直线
plt.scatter(x, y, label='Data')
plt.plot(x, y_pred, color='red', label='Linear Regression')

# 添加文本标签

plt.text(0.5, 14, f'Coefficients: {model.coef_[0]:.2f}', color='red')
plt.text(0.5, 12, f'Intercept: {model.intercept_:.2f}', color='red')
plt.text(0.5, 10, f'Loss: {loss:.2f}', color='red')
plt.title('Linear regression using Sklearn')
plt.legend()
plt.show()
In this example, we first load the data into a Pandas dataframe, then split it into independent and dependent variables (X and y).
We then create a LinearRegression object and fit the model to the data using the fit() method. Finally, we use the predict() method to make predictions of the dependent variable based on the independent variable, and print the coefficients and intercept of the linear regression model.
From scratch
import numpy as np
class LinearRegression:

    def __init__(self, learning_rate=0.001, n_iters=1000):
        """
        初始化Linear Regression模型的超参数。

        Parameters:
        learning_rate (float): 模型学习率,默认为0.001。
        n_iters (int): 模型训练迭代次数,默认为1000。
        """
        self.lr = learning_rate
        self.n_iters = n_iters
        self.weights = None
        self.bias = None

    def fit(self, X, y):
        """
        训练模型。

        Parameters:
        X (numpy.ndarray): 输入数据,形状为(n_samples, n_features)。
        y (numpy.ndarray): 目标数据,形状为(n_samples,)。
        """
        n_samples, n_features = X.shape

        # 初始化参数
        self.weights = np.zeros(n_features)
        self.bias = 0

        # 梯度下降
        for _ in range(self.n_iters):
            y_predicted = np.dot(X, self.weights) + self.bias
            # 计算梯度
            dw = (1 / n_samples) * np.dot(X.T, (y_predicted - y))
            db = (1 / n_samples) * np.sum(y_predicted - y)

            # 更新参数
            self.weights -= self.lr * dw
            self.bias -= self.lr * db


    def predict(self, X):
        """
        预测数据。

        Parameters:
        X (numpy.ndarray): 输入数据,形状为(n_samples, n_features)。

        Returns:
        y_approximated (numpy.ndarray): 预测的目标数据,形状为(n_samples,)。
        """
        y_approximated = np.dot(X, self.weights) + self.bias
        return y_approximated


import matplotlib.pyplot as plt
np.random.seed(100)

# 生成一维随机数据
x = np.linspace(0, 10, 50)
y = 2*x + 1 + np.random.normal(0, 2, 50)

# 创建LinearRegression实例并训练数据
model = LinearRegression()
model.fit(x.reshape(-1, 1), y)

# 计算预测值
y_pred = model.predict(x.reshape(-1, 1))

# 计算loss
loss = np.mean((y - y_pred) ** 2)

# 绘制散点图和拟合直线
plt.scatter(x, y, label='Data')
plt.plot(x, y_pred, color='red', label='Linear Regression')

# 添加系数和loss值到注释文本中
coef_text = 'Coefficients: w={}, b={}'.format(round(model.weights[0], 2), round(model.bias, 2))
loss_text = 'Loss: {}'.format(round(loss, 2))

# 添加系数和loss信息
plt.text(0.5, 14, f'Coefficients: {model.weights[0]:.2f}', color='red')
plt.text(0.5, 12, f'Intercept: {model.bias:.2f}', color='red')
plt.text(0.5, 10, f'Loss: {loss:.2f}', color='red')
plt.title('Linear regression using Numpy from scratch')
plt.legend()
plt.show()
本文由 mdnice 多平台发布


 7万+
7万+

 被折叠的 条评论
为什么被折叠?
被折叠的 条评论
为什么被折叠?
 到【灌水乐园】发言


