


Principal Component Analysis (PCA)
Summary
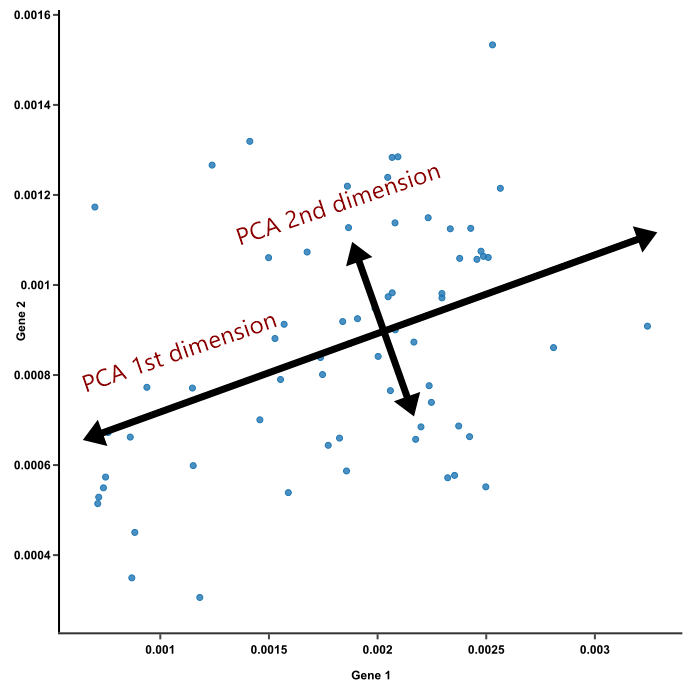
PCA is a dimensionality reduction technique that transforms correlated variables into a set of uncorrelated variables (principal components) while maximizing the variance and allowing for data visualization, noise reduction, and preprocessing in machine learning.
Key Takeaways
-
Dimensionality reduction: PCA helps reduce the dimensionality of high-dimensional datasets while retaining as much information as possible. It accomplishes this by transforming the data into a new set of variables called principal components. -
Orthogonal transformation: PCA performs an orthogonal transformation to convert a set of correlated variables into a set of linearly uncorrelated variables called principal components. Each principal component is a linear combination of the original variables. -
Variance maximization: PCA aims to maximize the variance of the data along the principal components. The first principal component captures the most significant amount of variance in the data, followed by the second, third, and so on. -
Dimension ranking: Principal components are ordered in terms of their importance or significance. The first few principal components usually explain the majority of the variance in the data, while the later components capture less and less variance. -
Dimension selection: PCA allows for selecting a subset of principal components that capture a desired percentage of the total variance in the data. This helps in reducing the dimensionality of the dataset while preserving a significant amount of information. -
Interpretability: The principal components are a linear combination of the original variables, and their coefficients can be used to understand the relationships between variables. However, as the number of principal components increases, interpretability becomes more challenging. -
Data visualization: PCA can be used to visualize high-dimensional data in a lower-dimensional space. By plotting the data based on the first few principal components, patterns and clusters in the data can become more apparent. -
Noise reduction: PCA can help reduce the impact of noise and eliminate redundant or irrelevant features by filtering out components with low variance. By focusing on the principal components capturing the most variance, the signal-to-noise ratio can be improved. -
Preprocessing tool: PCA is often used as a preprocessing step before applying machine learning algorithms. By reducing the dimensionality of the data, PCA can speed up training, reduce computational complexity, and help avoid overfitting. -
Assumptions: PCA assumes linearity, that the data has a multivariate normal distribution, and that there is a linear relationship between the variables and their principal components. These assumptions should be considered when applying PCA to a particular dataset.
Interview Questions
What is Principal Component Analysis (PCA) and what is its purpose in data analysis?
Principal Component Analysis (PCA) is a dimensionality reduction technique used in data analysis. Its purpose is to transform a high-dimensional dataset into a lower-dimensional space while preserving the most important information in the data. PCA achieves this by identifying the directions, known as principal components, along which the data varies the most.
How does PCA work? Explain the steps involved in performing PCA.
The steps involved in performing PCA are as follows:
Step 1: ==Standardize the data== - This involves scaling the variables to have zero mean and unit variance, ensuring that all variables contribute equally to the analysis.
Step 2: ==Calculate the covariance matrix== - Construct a covariance matrix based on the standardized data. The covariance matrix measures the relationships between different variables.
Step 3: ==Compute the eigenvectors and eigenvalues== - Find the eigenvectors and eigenvalues of the covariance matrix. The eigenvectors represent the principal components, and the corresponding eigenvalues indicate the amount of variance explained by each principal component.
Step 4: ==Select the principal components== - Sort the eigenvalues in descending order and choose the top-k eigenvectors that correspond to the largest eigenvalues. These eigenvectors form the principal components.
Step 5: ==Transform the data== - Project the standardized data onto the selected principal components to obtain the lower-dimensional representation of the original data.
What are the assumptions made in PCA?
There are a few assumptions made in PCA:
-
Linearity: PCA assumes that the relationships between variables are linear. -
Independence: PCA assumes that the variables are linearly independent of each other. -
Homoscedasticity: PCA assumes that the variance of the variables is constant across all levels of the other variables.
What is the significance of eigenvalues and eigenvectors in PCA?
Eigenvalues and eigenvectors are essential in PCA:
-
Eigenvalues represent the amount of variance explained by each principal component. Larger eigenvalues indicate that the corresponding principal component captures more information from the original data. -
Eigenvectors define the direction of each principal component. They are orthogonal to each other and represent the axes along which the data vary the most. Each eigenvector corresponds to a specific eigenvalue.
How do you determine the number of principal components to retain in PCA?
-
Scree plot: Plot the eigenvalues in descending order. The point where the plot levels off or starts to flatten indicates the number of significant principal components to retain. -
Cumulative variance explained: Calculate the cumulative variance explained by each principal component. Determine the number of components needed to reach a desired level of cumulative variance (e.g., 90% or 95%). -
Kaiser's criterion: Retain the components with eigenvalues greater than 1, as they explain more variance than a single original variable.
What is the interpretation of the principal components in PCA?
The principal components in PCA are linear combinations of the original variables. Each principal component represents a different axis or direction in the feature space. The interpretation of principal components depends on the context of the data and the specific variables involved. However, in general, the first principal component captures the direction of maximum variance in the data, while subsequent components capture orthogonal directions of decreasing variance. The principal components can be seen as new variables that are uncorrelated with each other and ordered by the amount of variance they explain.
Explain the concept of variance explained and cumulative variance explained in PCA.
Variance explained in PCA refers to the amount of total variance in the data that is accounted for by each principal component. The eigenvalues associated with the principal components represent the variance explained by each component. Larger eigenvalues indicate that the corresponding principal component captures more variance in the data.
Cumulative variance explained refers to the cumulative sum of the variances explained by the principal components. It helps determine the total amount of variance explained by including a certain number of components. The cumulative variance explained is useful for selecting the appropriate number of principal components to retain in order to balance dimensionality reduction and information preservation.
What are the limitations of PCA?
-
Linearity assumption: PCA assumes linearity between variables, so it may not perform well with non-linear relationships. -
Sensitivity to outliers: PCA is sensitive to outliers, as outliers can significantly influence the covariance matrix and, therefore, the principal components. -
Lack of interpretability: While PCA provides a lower-dimensional representation of the data, the resulting components may not have clear interpretability in terms of the original variables. -
Variance-based approach: PCA focuses solely on maximizing variance, which may not always capture the most important or relevant features in the data.
Can PCA be used for dimensionality reduction? If so, how?
Yes, PCA can be used for dimensionality reduction. After performing PCA, the principal components can be ranked based on the amount of variance they explain. By selecting a subset of the top-ranked components, you can reduce the dimensionality of the data while retaining the most important information. The reduced-dimension dataset is obtained by projecting the original data onto the selected principal components.
How is PCA different from other dimensionality reduction techniques, such as Factor Analysis or Independent Component Analysis (ICA)?
-
PCA aims to capture the directions of maximum variance in the data, while Factor Analysis focuses on identifying latent factors that underlie the observed variables. -
PCA assumes that the variables are linearly related, whereas Factor Analysis allows for both linear and non-linear relationships between variables. -
ICA aims to separate the original sources that contribute to the observed data, assuming that these sources are statistically independent, whereas PCA does not explicitly consider the independence of variables. -
PCA is based on the covariance matrix or correlation matrix of the data, while ICA focuses on finding a linear transformation that maximizes the statistical independence of the components. -
PCA is primarily used for dimensionality reduction and data visualization, while Factor Analysis and ICA are often employed for feature extraction or signal processing tasks.
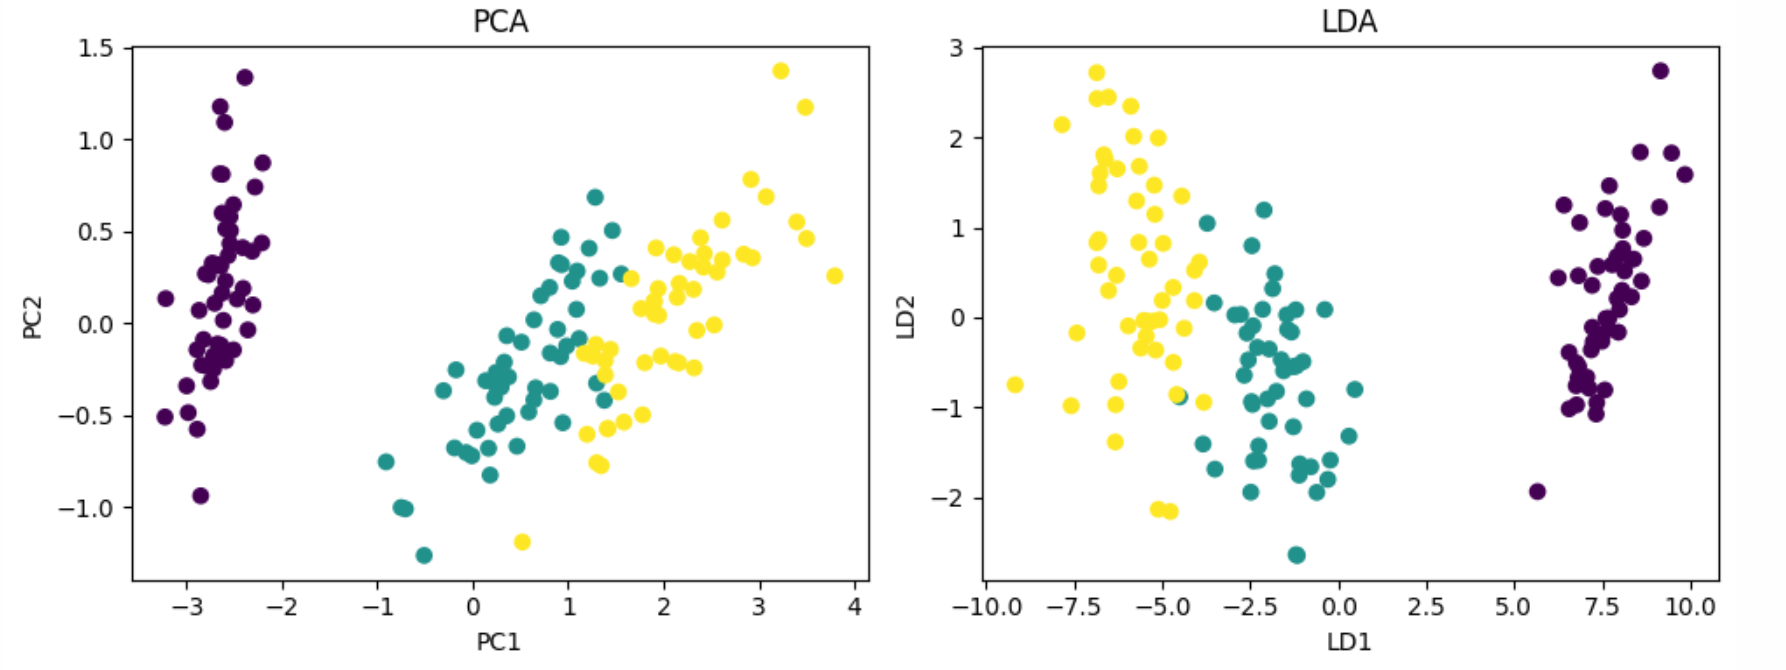
PCA vs. LDA
PCA (Principal Component Analysis) and LDA (Linear Discriminant Analysis) are both dimensionality reduction techniques, but they have different objectives and applications:
PCA (Principal Component Analysis):
-
Objective: PCA aims to capture the directions of maximum variance in the data. -
Unsupervised learning: PCA does not consider class labels or target variables during the dimensionality reduction process. -
Variance-based approach: PCA focuses on preserving the overall variability in the dataset. -
Applications: PCA is widely used for data visualization, noise reduction, and feature extraction.
LDA (Linear Discriminant Analysis):
-
Objective: LDA aims to find a linear projection that maximizes the separability between different classes or categories. -
Supervised learning: LDA takes into account the class labels or target variables during the dimensionality reduction process. -
Discriminative approach: LDA focuses on enhancing the class separability and reducing intra-class variability. -
Applications: LDA is commonly used for classification and pattern recognition tasks, where the goal is to maximize the separation between different classes.
In summary, while PCA focuses on preserving overall variability in the data, LDA aims to maximize the discriminative information between classes. PCA is useful for exploring and visualizing the structure of the data, while LDA is more suitable for classification tasks where class separability is critical.
Python Implementation
import matplotlib.pyplot as plt
from sklearn.decomposition import PCA
from sklearn.discriminant_analysis import LinearDiscriminantAnalysis
from sklearn.datasets import load_iris

# Load the Iris dataset
iris = load_iris()
X = iris.data
y = iris.target

# PCA implementation
pca = PCA(n_components=2)  # Reduce the dimensions to 2
X_pca = pca.fit_transform(X)

# LDA implementation
lda = LinearDiscriminantAnalysis(n_components=2)  # Reduce the dimensions to 2
X_lda = lda.fit_transform(X, y)

# Plotting PCA results
plt.figure(figsize=(10, 4))
plt.subplot(1, 2, 1)
plt.scatter(X_pca[:, 0], X_pca[:, 1], c=y, cmap='viridis')
plt.xlabel('PC1')
plt.ylabel('PC2')
plt.title('PCA')

# Plotting LDA results
plt.subplot(1, 2, 2)
plt.scatter(X_lda[:, 0], X_lda[:, 1], c=y, cmap='viridis')
plt.xlabel('LD1')
plt.ylabel('LD2')
plt.title('LDA')

plt.tight_layout()
plt.show()
本文由 mdnice 多平台发布


 965
965

 被折叠的 条评论
为什么被折叠?
被折叠的 条评论
为什么被折叠?
 到【灌水乐园】发言


