


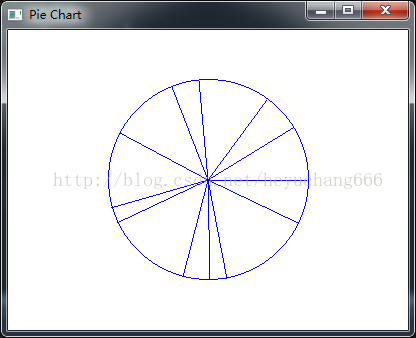
饼图用来给出整体中各部分的分布比例。使用中点圆算法子程序来构造一个饼图。例子中的值用于确定扇形的数量和大小,
该程序的输出请参见图。
#include "stdafx.h"
#include "GL/glut.h"
#include "stdlib.h"
#include "math.h"
#include "iostream"
using namespace std;

const GLdouble twoPi = 6.283185;

GLsizei winWidth = 400, winHeight = 300; // Initial display window size.
class screenPt {
public:
	screenPt(){
		x = y = 0;
	}
	GLint x, y;
	void setCoords(GLint xCoordValue, GLint yCorrdValue){
		x = xCoordValue;
		y = yCorrdValue;
	}
	GLint getx() const{
		return x;
	}
	GLint gety() const{
		return y;
	}
	void incrementx(){
		x++;
	}
	void incrementy(){
		y--;
	}
};

void init( )
{
	glClearColor(1.0, 1.0, 1.0, 1.0);
	glMatrixMode(GL_PROJECTION);
	gluOrtho2D(0.0, 200.0, 0.0, 150.0);
}

void setPixel(GLint xCoord, GLint yCoord){
	glBegin(GL_POINTS);
	glVertex2i(xCoord, yCoord);
	glEnd();
}

void circleMidpoint(GLint xc, GLint yc, GLint radius){
	screenPt circPt;
	GLint p = 1 - radius;//中点参数初值
	circPt.setCoords(0, radius);//Set coords for top point of circle
	void circlePlotPoints(GLint, GLint, screenPt);
	/*Plot the initial point in each circle quadrant*/
	circlePlotPoints(xc, yc, circPt);
	/*Calculate next point and plot in each octant*/
	while (circPt.getx() < circPt.gety()){
		circPt.incrementx();
		if (p < 0)
			p += 2 * circPt.getx() + 1;
		else{
			circPt.incrementy();
			p += 2 * (circPt.getx() - circPt.gety()) + 1;
		}
		circlePlotPoints(xc, yc, circPt);
	}
}

void circlePlotPoints(GLint xc, GLint yc, screenPt circPt)
{
	setPixel(xc + circPt.getx(), yc + circPt.gety());
	setPixel(xc - circPt.getx(), yc + circPt.gety());
	setPixel(xc + circPt.getx(), yc - circPt.gety());
	setPixel(xc - circPt.getx(), yc - circPt.gety());
	setPixel(xc + circPt.gety(), yc + circPt.getx());
	setPixel(xc - circPt.gety(), yc + circPt.getx());
	setPixel(xc + circPt.gety(), yc - circPt.getx());
	setPixel(xc - circPt.gety(), yc - circPt.getx());
}

void pieChart( )
{
	screenPt circCtr, piePt;
	GLint radius = winWidth / 4;         // Circle radius.

	GLdouble sliceAngle, previousSliceAngle = 0.0;

	GLint k, nSlices = 12;               // Number of slices.
	GLfloat dataValues[12] = { 10.0, 7.0, 13.0, 5.0, 13.0, 14.0, 3.0, 16.0, 5.0, 3.0, 17.0, 8.0 };
	GLfloat dataSum = 0.0;
	circCtr.x = winWidth / 2;            // Circle center position.
	circCtr.y = winHeight / 2;
	circleMidpoint(circCtr.x, circCtr.y, radius);    // 调用中点画圆方法

	for (k = 0; k < nSlices; k++)
		dataSum += dataValues[k];
	for (k = 0; k < nSlices; k++){
		sliceAngle = twoPi * dataValues[k] / dataSum + previousSliceAngle;
		piePt.x = circCtr.x + radius * cos(sliceAngle);
		piePt.y = circCtr.y + radius * sin(sliceAngle);
		glBegin(GL_LINES);
		glVertex2i(circCtr.x, circCtr.y);
		glVertex2i(piePt.x, piePt.y);
		glEnd();
		previousSliceAngle = sliceAngle;

	}
}


void displayFcn( )
{
	glClear(GL_COLOR_BUFFER_BIT);         // Clear display window.
	glColor3f(0.0, 0.0, 1.0);             // Set circle color to blue.
	pieChart();
	glFlush();
}


void winReshpeFcn(GLint newWidth, GLint newHeight)
{
	glMatrixMode(GL_PROJECTION);
	glLoadIdentity();
	gluOrtho2D(0.0, GLdouble(newWidth), 0.0, GLdouble(newHeight));
	glClear(GL_COLOR_BUFFER_BIT);
	/* Reset display-window size parameters. */
	winWidth = newWidth;
	winHeight = newHeight;
}
int _tmain(int argc, char** argv)
{
	glutInit(&argc, argv);
	glutInitDisplayMode(GLUT_SINGLE | GLUT_RGB);
	glutInitWindowPosition(100, 100);
	glutInitWindowSize(winWidth, winHeight);
	glutCreateWindow("Pie Chart");
	init();
	glutDisplayFunc(displayFcn);
	glutReshapeFunc(winReshpeFcn);
	glutMainLoop();
}


 1121
1121

 被折叠的 条评论
为什么被折叠?
被折叠的 条评论
为什么被折叠?
 到【灌水乐园】发言


