


Definitions
Consider a set of coplanar points P. For each point Px in the set P, you can draw a boundary enclosing all the intermediate points lying closer to Px than to other points in the set P. Such a boundary is called a Voronoi polygon, and the set of all Voronoi polygons for a given point set is called a Voronoi diagram.
Use one of these methods to plot a Voronoi diagram:
If you provide no output argument, voronoi plots the diagram.
To gain more control over color, line style, and other figure properties, use the syntax [vx,vy] = voronoi(...). This syntax returns the vertices of the finite Voronoi edges, which you can then plot with the plot function.
To fill the cells with color, use voronoin with n = 2 to get the indices of each cell, and then use patch and other plot functions to generate the figure. Note that patch does not fill unbounded cells with color.
This code uses the voronoi function to plot the Voronoi diagram for 10 randomly generated points.
x = gallery('uniformdata',[1 10],0);
y = gallery('uniformdata',[1 10],1);
voronoi(x,y)

This code uses the vertices of the finite Voronoi edges to plot the Voronoi diagram for the same 10 points.
x = gallery('uniformdata',[1 10],0);
y = gallery('uniformdata',[1 10],1);
[vx, vy] = voronoi(x,y);
plot(x,y,'r+',vx,vy,'b-'); axis equal
Note that you can add this code to get the figure shown in Example 1.
xlim([min(x) max(x)])
ylim([min(y) max(y)])

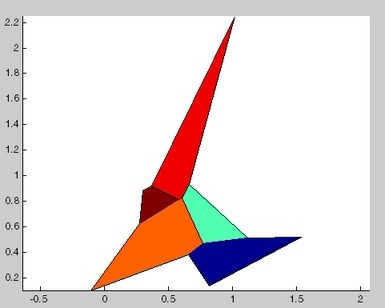
This code uses voronoin and patch to fill the bounded cells of the same Voronoi diagram with color.
x = gallery('uniformdata',[10 2],5);
[v,c]=voronoin(x);
for i = 1:length(c)
if all(c{i}~=1) % If at least one of the indices is 1,
% then it is an open region and we can't
% patch that.
patch(v(c{i},1),v(c{i},2),i); % use color i.
end
end


 4983
4983

 被折叠的 条评论
为什么被折叠?
被折叠的 条评论
为什么被折叠?
 到【灌水乐园】发言


