


前言
dtplyr的功能是实现用dplyr语句调用data.table函数操作数据集。
github 项目地址:
https://github.com/tidyverse/dtplyr
有小伙伴可能会问,我dplyr用的好好的,为什么要调用data.table呢?同样是做ETL,这不是多此一举吗?
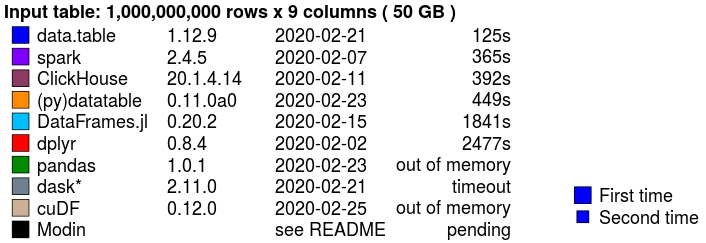
emm,这是因为data.table在执行速度与内存优化上要比dplyr优秀!不仅如此,当与python(pandas)、Julia(DataFrames.jl)、甚至是spark进行速度比较时仍然一枝独秀。
目前H2O组织 测试了多语言ETL效率对比:
https://h2oai.github.io/db-benchmark/
在50G(10亿行,9列)的数据量下
我们以一个kaggle上的信用卡消费数据集为例
百度网盘下载:
链接:https://pan.baidu.com/s/1Qv3nAJxfo7hxjdTOGoLOXA
提取码:f4ks
数据准备
pacman::p_load(tidyverse,
               data.table,
               dtplyr,
               microbenchmark)  #microbenchmark用来测试时间


data <- fread("D://contest//transactions.csv")


#扩充原data数据集100倍,并转换成tibble与lazy_dt两种类型
data_100_tbl <- sample_frac(tbl_df(data), 100, replace = T)
data_100_lazy <- lazy_dt(data_100_tbl)
> data_100_tbl
# A tibble: 18,512,900 x 14
authorized_flag card_id city_id category_1 installments category_3 merchant_catego~ merchant_id month_lag
<chr> <chr> <int> <chr> <int> <chr> <int> <chr> <int>
1 Y C_ID_d~ 117 N 1 B 278 "M_ID_9cef~ 2
2 Y C_ID_a~ 101 N 0 A 307 "M_ID_3af8~ 2
3 Y C_ID_a~ 57 N 0 A 557 "M_ID_b279~ 2
4 Y C_ID_7~ 58 N 0 A 373 "M_ID_7d34~ 2
5 Y C_ID_0~ 297 N 1 B 130 "M_ID_6cba~ 1
6 Y C_ID_0~ 19 N 1 B 367 "M_ID_0a11~ 1
7 Y C_ID_1~ 19 N 0 A 195 "M_ID_3887~ 1
8 Y C_ID_a~ 19 N 1 B 307 "M_ID_aeda~ 2
9 Y C_ID_d~ 4 N 1 B 45 "" 2
10 Y C_ID_7~ 143 N 1 B 195 "M_ID_9f44~ 1
# ... with 18,512,890 more rows, and 5 more variables: purchase_amount <dbl>, purchase_date <chr>,
# category_2 <int>, state_id <int>, subsector_id <int>
> data_100_lazy
Source: local data table [18,512,900 x 14]
Call: `_DT2`
authorized_flag card_id city_id category_1 installments category_3 merchant_catego~ merchant_id month_lag
<chr> <chr> <int> <chr> <int> <chr> <int> <chr> <int>
1 Y C_ID_d~ 117 N 1 B 278 M_ID_9cef8~ 2
2 Y C_ID_a~ 101 N 0 A 307 M_ID_3af85~ 2
3 Y C_ID_a~ 57 N 0 A 557 M_ID_b2798~ 2
4 Y C_ID_7~ 58 N 0 A 373 M_ID_7d347~ 2
5 Y C_ID_0~ 297 N 1 B 130 M_ID_6cba6~ 1
6 Y C_ID_0~ 19 N 1 B 367 M_ID_0a11b~ 1
# ... with 5 more variables: purchase_amount <dbl>, purchase_date <chr>, category_2 <int>, state_id <int>,
# subsector_id <int>
# Use as.data.table()/as.data.frame()/as_tibble() to access results与dplyr执行速度比较
1
比较构建
#由于同时加载了tidyverse与dtplyr包,同样使用dplyr语句的情况下:
对于tibble类型的数据框会自动适用dplyr语句进行处理;
对于lazy_dt类型会自动转换成data.table语句处理
timediff <- microbenchmark("dplyr" = {
  data_100_tbl %>%
    group_by(card_id) %>%
    summarise(purchase_sum = sum(purchase_amount)) %>%
    mutate(sum_log = log(abs(purchase_sum) + 1)) %>%
    arrange(desc(sum_log))
  },
  "dtplyr" = {
    data_100_lazy %>%
      group_by(card_id) %>%
      summarise(purchase_sum = sum(purchase_amount)) %>%
      mutate(sum_log = log(abs(purchase_sum) + 1)) %>%
      arrange(desc(sum_log))
  },
  times = 5 #进行5次重复实验
)
2
查看耗时
> timediff
Unit: milliseconds
   expr         min          lq        mean      median          uq      max neval cld
  dplyr 6758.845802 6781.060200 6819.021741 6790.808502 6806.278500 6958.116     5   b
 dtplyr    1.084701    1.111001    1.585181    1.363301    1.471902    2.895     5  a
#dplyr 平均用时:6819毫秒
#dtplyr平均用时:1.58毫秒!!!
3
耗时比较
> 6819.021741/1.585181
[1] 4301.731#效率整整提升了4000多倍兄弟们!!!


4
类型转换耗时
> microbenchmark(tbl_df(result_dtplyr), times = 5)
Unit: milliseconds
                  expr      min       lq     mean   median       uq      max neval
 tbl_df(result_dtplyr) 982.1994 986.0753 1015.474 992.0033 995.4669 1121.627     5
#5次实验中平均耗时:1015.474 毫秒
总结
data.table在运行效率与内存优化方面不仅超越R中dplyr体系,在与其他语言的平行包的比较下也是成绩优越。
dplyr在配合管道操作符时对代码的可读性提高也是指数级的 。
。
现在两者的结合:dtplyr,让R用户可以编写dplyr的人性化函数语句,来调用高效的data.table进行底层数据运算,使高可读性与高计算效率融为一体。
关联知识点:
·END·
R语言与数据分析
生产力干货


 1120
1120


 被折叠的 条评论
为什么被折叠?
被折叠的 条评论
为什么被折叠?
 到【灌水乐园】发言


