


利用lstm神经网络根据路谱估算道路坡度
一、 问题
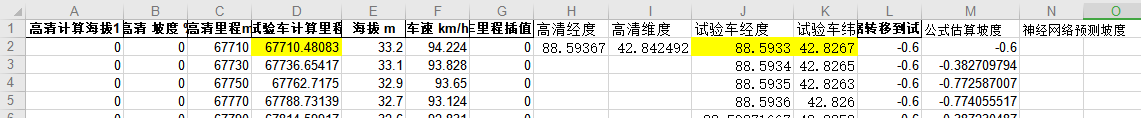
车辆侧得的路谱数据中有海拔、车速、经纬度等,但是没有道路坡度数据,高清地图中有经纬度及道路坡度,但是路程比较短。如何利用高清地图中的道路坡度,结合车辆的路谱数据估算全路段的道路坡度?
二、思路
1、根据经纬度将高清地图上的道路坡度转移到车辆试验路谱上;
2、构建lstm深度学习神经网络模型,输入28s的海拔、车速、计算得到的道路坡度数据,输出为第28s时的道路坡度,高清地图转移过来的道路坡度作为标准答案,对神经网络模型进行训练。
三、结果
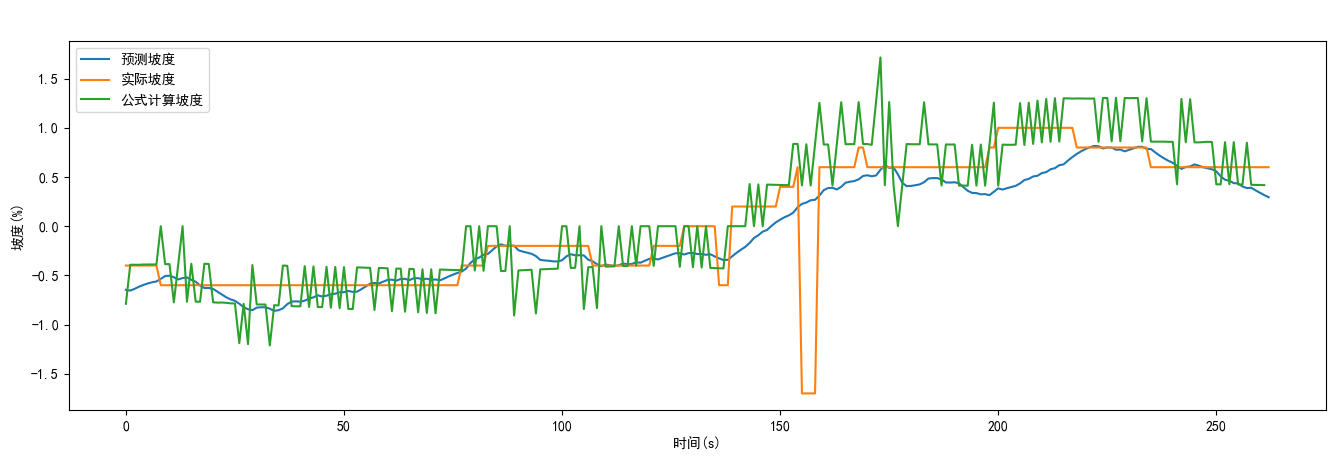
利用前100s数据进行训练,100-27=73个训练样本,用训练好的模型输入前290s的路谱,计算得到估算的道路坡度,前73s可观察训练的数据拟合情况,后面的时刻为道路坡度的估算情况,见下图。
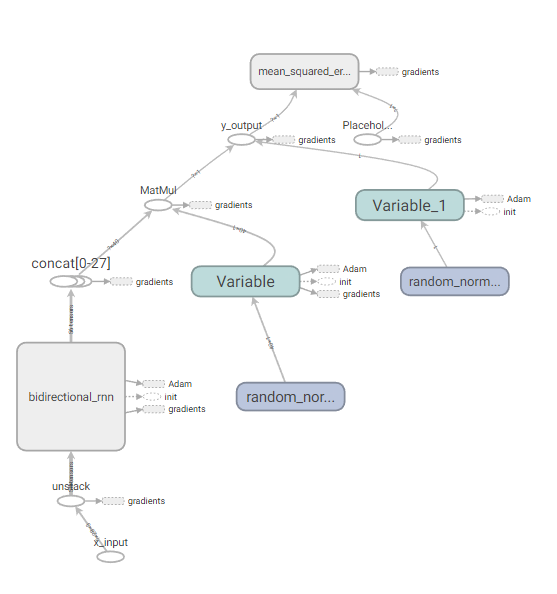
四、利用tensorboard根据训练的日志文件观察训练的过程及神经网络模型

损失函数值:

神经网络模型:
五、神经网络代码
# coding=utf-8
import os
os.environ["TF_CPP_MIN_LOG_LEVEL"]='2' # ֻ��ʾ warning �� Error

###data (7000,3),(740,3),(740,3):
import numpy as np
import tensorflow as tf
from tensorflow.contrib import rnn
import pandas as pd

#define constants
#28个时间步,根据前28个时刻的输入路谱预测最后一时刻的坡度:
TIME_STEPS=28
#hidden LSTM units
NUM_HIDDEN=20
#输入3个特征:H_V_icom
NUM_INPUT=3
#learning rate for adam
LEARNING_RATE=0.001
#输出一个特征,最后一时刻的坡度:
NUM_OUTPUT=1
#data数:
NUM_DATA=100
#size of batch
BATCH_SIZE=50

TRAINING_EPOCHS=1000#

#起始点:
ind_start=50
#从路谱中截取一系列TIME_STEPS=28个值作为训练的样本::
#X (:,28,3);
#y (:,1)
def generate_data(seq):
    X=[]
    y=[]
    for i in range(len(seq)-TIME_STEPS+1): #+1 by lijilin20220708
        X.append(seq[i:i+TIME_STEPS,:3])
        y.append([seq[int(i+TIME_STEPS-1),-1]]) #last as y
    return np.array(X,dtype=np.float32),np.array(y,dtype=np.float32)
    #seq[i:i+TIME_STEPS,:]是二维数组,不用再在外面加【】
    #seq[i+TIME_STEPS,-1]是0维数组=值,需要在外面加【】变成一维表

###:文件数据处理:
H_V_i_MAX=[2000,140,10,10]
file_path = r'C:\Users\li\AppData\Local\ttt\data.xls'
dataFrame = pd.read_excel(file_path)
data=dataFrame.values[ind_start:NUM_DATA+ind_start,(4,5,12,11)] #二维数组
#数据归一化:
data=data/H_V_i_MAX

#trainData_in (:,28,3);
#trainData_out (:,1)
trainData_in,trainData_out=generate_data(data)

#weights and biases of appropriate shape to accomplish above task
#out_weights=tf.Variable(tf.random_normal([NUM_HIDDEN,NUM_OURPUT]))
#双向神经网络的权重为单向的2倍尺度:
out_weights=tf.Variable(tf.random_normal([2*NUM_HIDDEN,NUM_OUTPUT]))
out_bias=tf.Variable(tf.random_normal([NUM_OUTPUT]))
#defining placeholders
#input image placeholder:
x_input=tf.placeholder("float",[None,TIME_STEPS,NUM_INPUT],name='x_input')
#input label placeholder:
y_desired=tf.placeholder("float",[None,NUM_OUTPUT])
#processing the input tensor from [BATCH_SIZE,NUM_STEPS,NUM_INPUT] to "TIME_STEPS" number of [BATCH-SIZE,NUM_INPUT] tensors!:
#对输入的一个张量的第二维解包变成TIME_STEPS个张量!:
x_input_step=tf.unstack(x_input ,TIME_STEPS,1)

#defining the network:
#def BiRNN(x_input_step,out_weights,out_bias):
#lstm_layer=rnn.BasicLSTMCell(NUM_HIDDEN,forget_bias=1.0)
#正向神经元:
lstm_fw_cell=rnn.BasicLSTMCell(NUM_HIDDEN,forget_bias=1.0)
#反向神经元:
lstm_bw_cell=rnn.BasicLSTMCell(NUM_HIDDEN,forget_bias=1.0)
#outputs,_=rnn.static_rnn(lstm_layer,x_input_step,dtype="float32")
#构建双向LSTM网络:
outputs,_,_=rnn.static_bidirectional_rnn( lstm_fw_cell,lstm_bw_cell,x_input_step,dtype="float32")
#converting last output of dimension [batch_size,num_hidden] to [batch_size,num_classes] by out_weight multiplication
z_prediction= tf.add(tf.matmul(outputs[int(TIME_STEPS-1)],out_weights),out_bias,name='y_output')  #中间值输出
#z_prediction=BiRNN(x_input_step, out_weights, out_bias)
#注意!z_prediction经softmax归一化后才是最终的输出,用于和标签比较,下面的损失函数中用了softmax哈交叉熵,跳过了求y_output这一步:
#y_output=tf.nn.softmax(z_prediction,name='y_output')

#loss_function:
#loss=tf.reduce_mean(tf.nn.softmax_cross_entropy_with_logits_v2(logits=z_prediction,labels=y_desired),name='loss')
loss=tf.losses.mean_squared_error(labels=y_desired,predictions=z_prediction)
#optimization
opt=tf.train.AdamOptimizer(learning_rate=LEARNING_RATE).minimize(loss)
#model evaluation
#correct_prediction=tf.equal(tf.argmax(z_prediction,1),tf.argmax(y_desired,1))
#accuracy=tf.reduce_mean(tf.cast(correct_prediction,tf.float32))


#以下汇总一些参数用于TensorBoard:
for value in [loss]:
    tf.summary.scalar(value.op.name,value) #汇总的标签及值
summary_op=tf.summary.merge_all() #汇总合并

#initialize variables:
init=tf.global_variables_initializer()

with tf.Session() as sess:
    # 生成一个写日志的writer,并将当前的tensorflow计算图写入日志。
    # tensorflow提供了多种写日志文件的API
    summary_writer=tf.summary.FileWriter(r'C:\temp\log_simple_stats',sess.graph)

    sess.run(init)
    num_batches=int(len(trainData_in)/BATCH_SIZE)
    for epoch in range(TRAINING_EPOCHS):
        for i in range(num_batches):
            batch_x=trainData_in[i*BATCH_SIZE:(i+1)*BATCH_SIZE]
            batch_x=batch_x.reshape((BATCH_SIZE,TIME_STEPS,NUM_INPUT))#
            batch_y=trainData_out[i*BATCH_SIZE:(i+1)*BATCH_SIZE]
            #优化及日志结果!!!!!!:::::
            _,summary=sess.run([opt,summary_op], feed_dict={x_input: batch_x, y_desired: batch_y})
            #写日志,将结果添加到汇总:
            summary_writer.add_summary(summary,global_step=epoch*num_batches+i)
            if i %10==0:
                #acc=sess.run(accuracy,feed_dict={x_input:batch_x,y_desired:batch_y})
                los=sess.run(loss,feed_dict={x_input:batch_x,y_desired:batch_y})
                print('epoch:%4d,'%epoch,'%4d'%i)
                #print("Accuracy ",acc)
                print("Loss ",los)
                print("__________________")
    print("Finished!")
    #print("Test Accuracy ",sess.run(accuracy,\
    #                                feed_dict={x_input:testData_in.reshape((-1,TIME_STEPS,NUM_INPUT)),\
    #                                           y_desired:testData_out}))
    saver=tf.train.Saver()
    save_path=saver.save(sess,'../data')
    print('Model saved to %s' % save_path)
    summary_writer.close()
五、神经网络模型调用代码
# coding=utf-8
import os
os.environ["TF_CPP_MIN_LOG_LEVEL"]='2' # ֻ��ʾ warning �� Error

###data (7000,3),(740,3),(740,3):
import numpy as np
import tensorflow as tf
from tensorflow.contrib import rnn
import pandas as pd
import matplotlib.pyplot as plt

plt.rcParams['font.sans-serif']=['SimHei'] #用来正常显示中文标签
plt.rcParams['axes.unicode_minus']=False #用来正常显示负号

#define constants
#28个时间步,根据前28个时刻的输入路谱预测最后一时刻的坡度:
TIME_STEPS=28
#输入3个特征:
NUM_INPUT=3
#data数:
NUM_DATA=290
#起始点:
ind_start=1

#从路谱中截取一系列TIME_STEPS=28个值作为训练的样本::
#X (:,28,3);
#y (:,1)
def generate_data(seq):
    X=[]
    y=[]
    for i in range(len(seq)-TIME_STEPS+1): #+1 by lijilin20220708
        X.append(seq[i:i+TIME_STEPS,:3])
        y.append([seq[int(i+TIME_STEPS-1),-1]])
    return np.array(X,dtype=np.float32),np.array(y,dtype=np.float32)
    #seq[i:i+TIME_STEPS,:]是二维数组,不用再在外面加【】
    #seq[i+TIME_STEPS,-1]是0维数组=值,需要在外面加【】变成一维表

###:文件数据处理:
H_V_i_MAX=[2000,140,10,10]
file_path = r'C:\Users\li\AppData\Local\ttt\data.xls'
dataFrame = pd.read_excel(file_path,sheet_name=0)
data=dataFrame.values[ind_start:NUM_DATA+ind_start,(4,5,12,11)] #二维数组
#数据归一化:
data=data/H_V_i_MAX

#testData_in (:,28,3);
#testData_out (:,1)
testData_in,testData_out=generate_data(data)

sess=tf.InteractiveSession()
new_saver=tf.train.import_meta_graph('../data.meta')
new_saver.restore(sess, '../data')
tf.get_default_graph().as_graph_def()
x_input=sess.graph.get_tensor_by_name('x_input:0')
y_output=sess.graph.get_tensor_by_name('y_output:0')

try_input=testData_in[:NUM_DATA-TIME_STEPS+1] #+1 by lijilin20220708
try_desired=testData_out[:NUM_DATA-TIME_STEPS+1] #+1 by lijilin20220708
try_predictions=y_output.eval(feed_dict={x_input:\
                               np.array([try_input]).reshape((-1,TIME_STEPS,NUM_INPUT))})
#print(np.stack((try_desired,try_predictions),-1))

plt.plot(try_predictions*10,label=u'预测坡度')
plt.plot(try_desired*10,label=u'实际坡度')
plt.plot(testData_in[:NUM_DATA-TIME_STEPS,-1,2]*10,label=u'公式计算坡度')
plt.ylabel(u'坡度(%)')
plt.xlabel(u'时间(s)')
plt.legend()
plt.show()

dataFrame.values[ind_start+TIME_STEPS-1:NUM_DATA+ind_start,13]=10*try_predictions.reshape((np.size(try_predictions)))
dataFrame.to_excel(r'C:\Users\li\AppData\Local\ttt\data_predic.xls',index=0)


 1002
1002


 被折叠的 条评论
为什么被折叠?
被折叠的 条评论
为什么被折叠?
 到【灌水乐园】发言


