


随机森林:
什么是随机森林?
随机森林,顾名思义,里面有很多棵树,它基于决策树,将多个决策树结合在一起后把它们的预测结果结合起来预测目标,是集成算法中一种典型的Bagging模型。
集成算法:
通过构建并结合多个机器学习器来完成学习任务,让机器学习效果更好。
常见的集成算法模型有:Bagging,Boosting,Stacking
Bagging:
训练多个分类器取平均值:
f
(
x
)
=
1
/
M
∑
f
m
(
x
)
f(x)=1/M∑fm(x)
f(x)=1/M∑fm(x)
Boosting:
从弱学器开始加强,不断建立新的模型,通过加权进行训练,加入一棵树,要比原来的更强
Stacking:
聚合多个分类或回归模型
随机森林的原理:
随机,一是指对数据集有放回地随机采样,二是指对采样后的样本特征进行随机采取,最后通过二者构建一棵棵结果不同的并行决策树模型,森林由此而来。
多数表决:随机森林的最终结果是由所有的决策树结果综合得出的,对于分类问题,每个决策树会输出一个分类标签,随机森林对所有决策树输出的的分类标签进行多数投票,以得出最终的分类结果。对于回归问题,每颗树输出的回归结果进行平均操作,得出随机森林的输出结果。
[外链图片转存失败,源站可能有防盗链机制,建议将图片保存下来直接上传(img-C0PL6Tqj-1685342686645)(C:\Users\ASUS\Desktop\QQ图片20230528155856.png)]
随机森林建模过程:
随机森林的优点:
- 可处理很高维度(feature很多)的数据,并且不用做特征选择
- 并行化,速度比较快
- 可以在训练完之后,评估哪些feature比较重要
- 可以判断不同特征之间的相互影响
- 对于不平衡的分类资料集来说,可以平衡误差
- 不容易过拟合
随机森林的缺点:
被证明在某些噪音较大的分类或回归问提上会过拟合
当训练数据少于分类类别的时候表现很差
对于有不同取值的属性的数据,取值划分较多的属性会对随机森林产生更大的影响
随机森林代码实现:
代码来自这里
随机森林分类:
生成分类样例数据:
from sklearn.datasets import make_classification

X, y = make_classification(n_features = 2, n_informative = 2, n_redundant = 0, n_samples = 100, n_classes = 2, random_state = 0)
y[y == 0] = -1
随机森林分类实现:
import numpy as np
from sklearn.tree import DecisionTreeClassifier

class rfc:
    """
    随机森林分类器
    """
    def __init__(self, n_estimators = 100, random_state = 0):
        # 随机森林的大小
        self.n_estimators = n_estimators
        # 随机森林的随机种子
        self.random_state = random_state
    def fit(self, X, y):
        """
        随机森林分类器拟合
        """
        self.y_classes = np.unique(y)
        # 决策树数组
        dts = []
        n = X.shape[0]
        rs = np.random.RandomState(self.random_state)
        for i in range(self.n_estimators):
            # 创建决策树分类器
            dt = DecisionTreeClassifier(random_state=rs.randint(np.iinfo(np.int32).max), max_features = "auto")
            # 根据随机生成的权重,拟合数据集
            dt.fit(X, y, sample_weight=np.bincount(rs.randint(0, n, n), minlength = n))
            dts.append(dt)
        self.trees = dts
    def predict(self, X):
        """
        随机森林分类器预测
        """
        # 预测结果数组
        probas = np.zeros((X.shape[0], len(self.y_classes)))
        for i in range(self.n_estimators):
            # 决策树分类器
            dt = self.trees[i]
            # 依次预测结果可能性
            probas += dt.predict_proba(X)
        # 预测结果可能性取平均
        probas /= self.n_estimators
        # 返回预测结果
        return self.y_classes.take(np.argmax(probas, axis = 1), axis = 0)
随机森林分类拟合:
# 随机森林分类器
rf = rfc()
# 拟合数据集
rf.fit(X, y)
随机森林分类数据可视化:
import numpy as np
import matplotlib.pyplot as plt
from matplotlib.colors import LinearSegmentedColormap

plt.rcParams['font.sans-serif'] = ['PingFang HK']  # 选择一个本地的支持中文的字体
fig, ax = plt.subplots()
ax.set_facecolor('#f8f9fa')
x_min, x_max = X[:, 0].min() - .5, X[:, 0].max() + .5
y_min, y_max = X[:, 1].min() - .5, X[:, 1].max() + .5
xx, yy = np.meshgrid(np.arange(x_min, x_max, .05), np.arange(y_min, y_max, .05))
Z = rf.predict(np.c_[xx.ravel(), yy.ravel()])
Z = Z.reshape(xx.shape)
clist=['#ffadad', '#8ecae6']
newcmp = LinearSegmentedColormap.from_list('point_color', clist)
plt.pcolormesh(xx, yy, Z, cmap = newcmp)
plt.xlim(xx.min(), xx.max())
plt.ylim(yy.min(), yy.max())
x1 = X[y==-1][:, 0]
y1 = X[y==-1][:, 1]
x2 = X[y==1][:, 0]
y2 = X[y==1][:, 1]
p1 = plt.scatter(x1, y1, c='#e63946', marker='o', s=20)
p2 = plt.scatter(x2, y2, c='#457b9d', marker='x', s=20)
ax.set_title('随机森林分类', color='#264653')
ax.set_xlabel('X1', color='#264653')
ax.set_ylabel('X2', color='#264653')
ax.tick_params(labelcolor='#264653')
plt.legend([p1, p2], ["-1", "1"], loc="upper left")
plt.show()

随机森林回归:
生成回归样例数据:
from sklearn.datasets import make_regression

X, y = make_regression(n_features = 1, n_targets = 1, n_samples = 100, noise=5, random_state = 0)
随机森林回归实现:
import numpy as np
from sklearn.tree import DecisionTreeRegressor

class rfr:
    """
    随机森林回归器
    """
    def __init__(self, n_estimators = 100, random_state = 0):
        # 随机森林的大小
        self.n_estimators = n_estimators
        # 随机森林的随机种子
        self.random_state = random_state
    def fit(self, X, y):
        """
        随机森林回归器拟合
        """
        # 决策树数组
        dts = []
        n = X.shape[0]
        rs = np.random.RandomState(self.random_state)
        for i in range(self.n_estimators):
            # 创建决策树回归器
            dt = DecisionTreeRegressor(random_state=rs.randint(np.iinfo(np.int32).max), max_features = "auto")
            # 根据随机生成的权重,拟合数据集
            dt.fit(X, y, sample_weight=np.bincount(rs.randint(0, n, n), minlength = n))
            dts.append(dt)
        self.trees = dts
    def predict(self, X):
        """
        随机森林回归器预测
        """
        # 预测结果
        ys = np.zeros(X.shape[0])
        for i in range(self.n_estimators):
            # 决策树回归器
            dt = self.trees[i]
            # 依次预测结果
            ys += dt.predict(X)
        # 预测结果取平均
        ys /= self.n_estimators
        return ys
随机森林回归拟合:
# 随机森林回归器
rf = rfr()
# 拟合数据集
rf.fit(X, y)
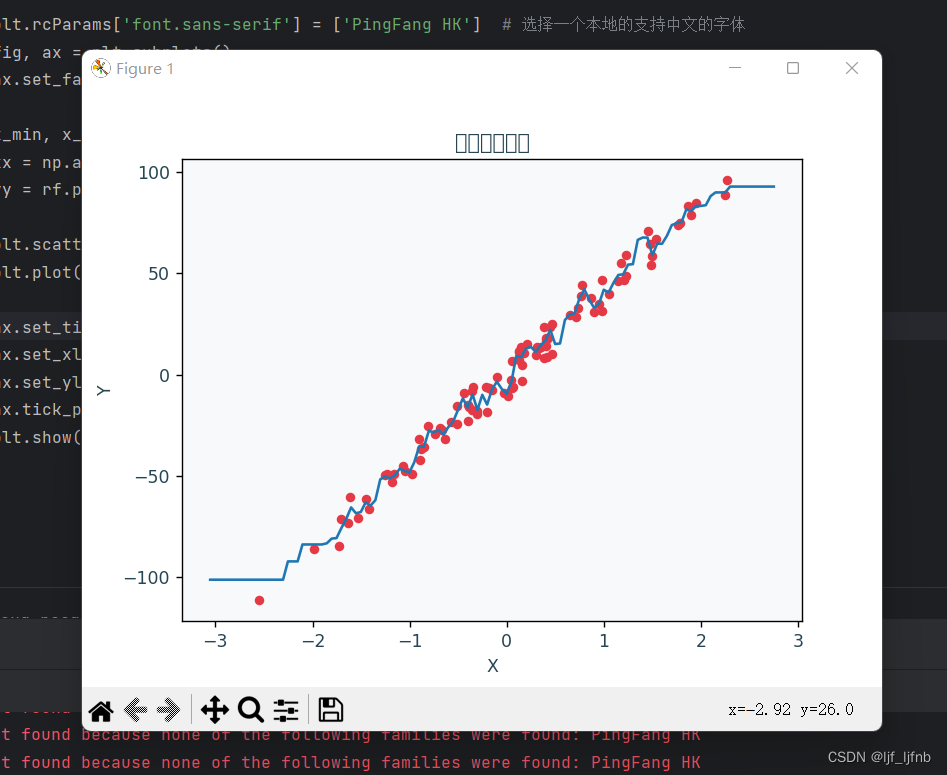
随机森林回归可视化:
import numpy as np
import matplotlib.pyplot as plt
from matplotlib.colors import LinearSegmentedColormap

plt.rcParams['font.sans-serif'] = ['PingFang HK']  # 选择一个本地的支持中文的字体
fig, ax = plt.subplots()
ax.set_facecolor('#f8f9fa')
x_min, x_max = X[:, 0].min() - .5, X[:, 0].max() + .5
xx = np.arange(x_min, x_max, .05)
yy = rf.predict(np.c_[xx.ravel()])
plt.scatter(X, y, c='#e63946', marker='o', s=20)
plt.plot(xx, yy)
ax.set_title('随机森林回归', color='#264653')
ax.set_xlabel('X', color='#264653')
ax.set_ylabel('Y', color='#264653')
ax.tick_params(labelcolor='#264653')
plt.show()


 391
391


 被折叠的 条评论
为什么被折叠?
被折叠的 条评论
为什么被折叠?
 到【灌水乐园】发言


