


目录
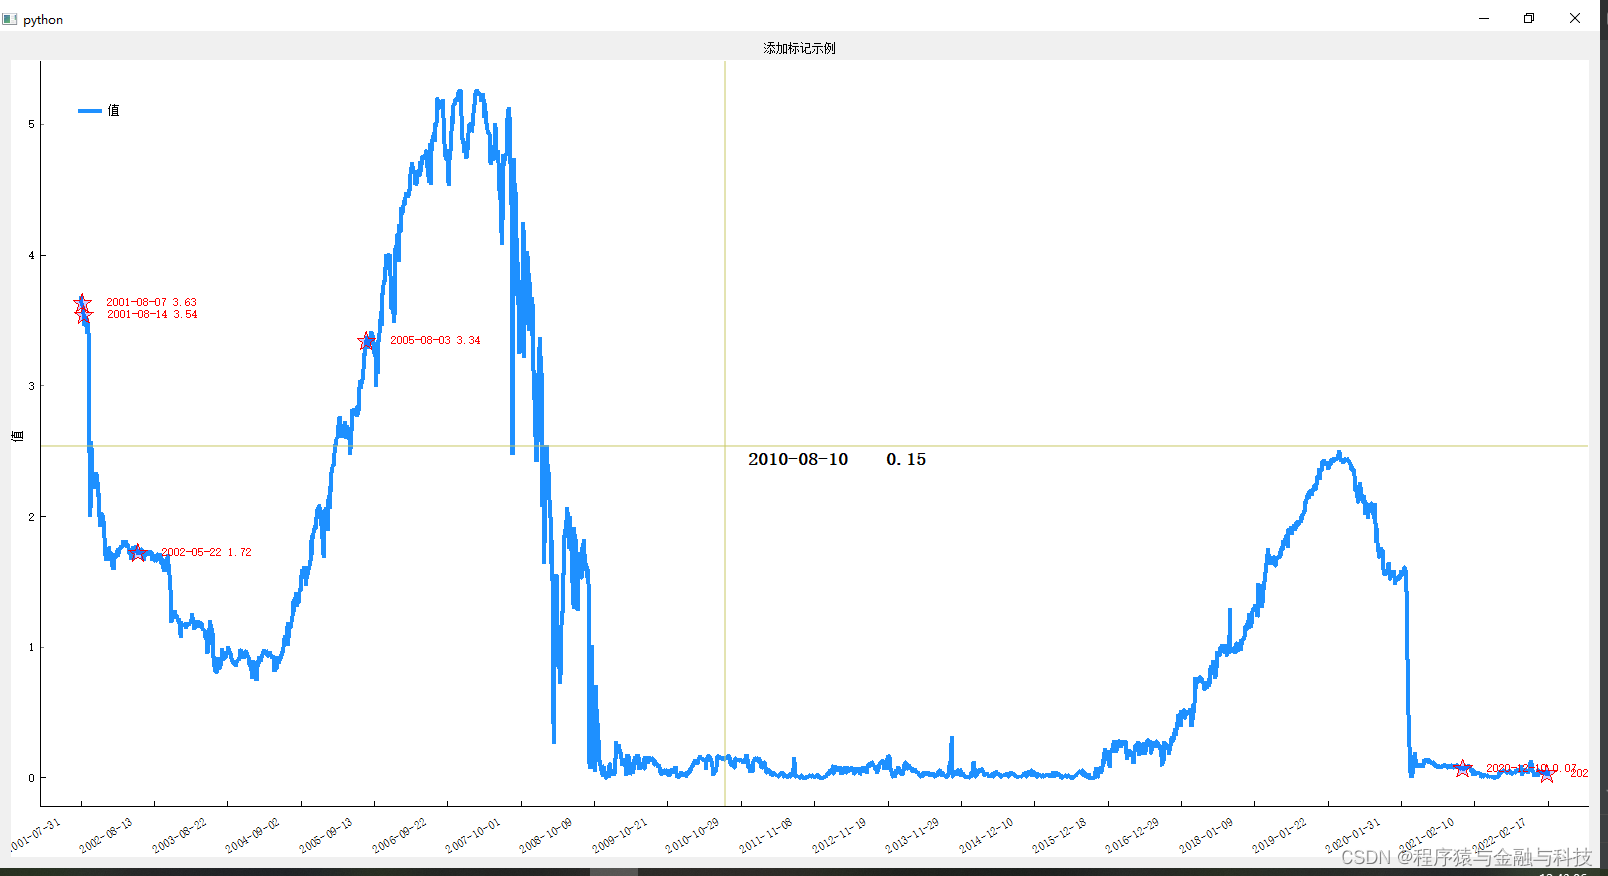
效果:
代码:
import sys
import pandas as pd
from PyQt5 import QtCore,QtWidgets
from PyQt5.QtCore import Qt
from typing import Any,Dict,List
import pyqtgraph as pg
pg.setConfigOption('background', 'w')
pg.setConfigOption('foreground', 'k')
自定义坐标控件
class RotateAxisItem(pg.AxisItem):
    def drawPicture(self, p, axisSpec, tickSpecs, textSpecs):
        p.setRenderHint(p.Antialiasing,False)
        p.setRenderHint(p.TextAntialiasing,True)

        ## draw long line along axis
        pen,p1,p2 = axisSpec
        p.setPen(pen)
        p.drawLine(p1,p2)
        p.translate(0.5,0)  ## resolves some damn pixel ambiguity

        ## draw ticks
        for pen,p1,p2 in tickSpecs:
            p.setPen(pen)
            p.drawLine(p1,p2)

        ## draw all text
        # if self.tickFont is not None:
        #     p.setFont(self.tickFont)
        p.setPen(self.pen())
        for rect,flags,text in textSpecs:
            # this is the important part
            p.save()
            p.translate(rect.x(),rect.y())
            p.rotate(-30)
            p.drawText(-rect.width(),rect.height(),rect.width(),rect.height(),flags,text)
            # restoring the painter is *required*!!!
            p.restore()
可以添加和去除标记的折线图控件
class PyQtGraphWidget(QtWidgets.QWidget):
def __init__(self):
super().__init__()
self.line_type: int = 1
self.init_data()
self.init_ui()
def init_data(self):
# 存储标记控件对象
self.mark_list = []
# 单根曲线的颜色值
self.color_one = (30,144,255)
pass
def init_ui(self):
self.title_label = QtWidgets.QLabel('折线图')
self.title_label.setAlignment(Qt.AlignCenter)
# 使用自定义的坐标轴,使得横坐标可以倾斜显示
xax = RotateAxisItem(orientation='bottom')
xax.setHeight(h=50)
self.pw = pg.PlotWidget(axisItems={'bottom': xax})
# 以下两句作用:鼠标滚轮缩放对折线图只作用在x轴上,x,y坐标轴上的数值会跟随缩放
# 只在x轴缩放折线图可以避免画布中空白,找不到图
self.pw.setMouseEnabled(x=True,y=False)
self.pw.setAutoVisible(x=False,y=True)
layout = QtWidgets.QVBoxLayout()
layout.addWidget(self.title_label)
layout.addWidget(self.pw)
self.setLayout(layout)
pass
def set_data(self, data: Dict[str, Any]):
'''单根y轴'''
self.line_type = 1
if data is None:
self.pw.clear()
return
# 将上一次视图清空
self.pw.clear()
self.pw.addLegend()
title_str = data['title_str']
self.title_label.setText(title_str)
xTick = [data['xTick00']]
x = data['x']
y = data['y']
y_name = data['y_name']
self.pw.setLabel('left', y_name)
self.y_datas = y
self.x_data = xTick
self.x_Tick = data['xTick']
self.y_name = y_name
xax = self.pw.getAxis('bottom')
xax.setTicks(xTick)
self.pw.plot(x, y, connect='finite', pen=pg.mkPen({'color': self.color_one, 'width': 4}), name=self.y_name)
self.vLine = pg.InfiniteLine(angle=90, movable=False)
self.hLine = pg.InfiniteLine(angle=0, movable=False)
self.label = pg.TextItem()
self.pw.addItem(self.vLine, ignoreBounds=True)
self.pw.addItem(self.hLine, ignoreBounds=True)
self.pw.addItem(self.label, ignoreBounds=True)
self.vb = self.pw.getViewBox()
self.proxy = pg.SignalProxy(self.pw.scene().sigMouseMoved, rateLimit=60, slot=self.mouseMoved)
# 显示整条折线图
self.pw.enableAutoRange()
pass
def mouseMoved(self,evt):
pos = evt[0]
if self.pw.sceneBoundingRect().contains(pos):
mousePoint = self.vb.mapSceneToView(pos)
index = int(mousePoint.x())
if index >= 0 and index < len(self.y_datas):
x_str = self.x_Tick[index][1]
y_str_html = ''
y_str = str(self.y_datas[index])
y_str_html += ' ' + y_str
if self.line_type == 2:
y_str2 = str(self.y_datas2[index])
y_str_html += ' '+y_str2
html_str = '<p style="color:black;font-size:18px;font-weight:bold;"> ' + x_str +' '+y_str_html+ '</p>'
self.label.setHtml(html_str)
self.label.setPos(mousePoint.x(), mousePoint.y())
self.vLine.setPos(mousePoint.x())
self.hLine.setPos(mousePoint.y())
pass
def add_mark(self,data_index_list:List[Any],data_str_list:List[str]):
'''添加标记'''
for i,i_item in enumerate(data_index_list):
temp_str = data_str_list[i]
targetItem = pg.TargetItem(
pos=(i_item[0],i_item[1]),
size=20,
symbol='star',
movable=False,
pen='#FF0000'
)
targetItem.setLabel(
temp_str,
{
"anchor": QtCore.QPointF(0.5, 0.5),
"offset": QtCore.QPoint(70, 0),
"color": "#FF0000"
}
)
self.mark_list.append(targetItem)
self.pw.addItem(targetItem)
pass
def remove_mark(self):
'''去除标记'''
for item in self.mark_list:
self.pw.removeItem(item)
pass使用:
if __name__ == '__main__':
    pre_dir = r'E:/temp055/'
    # twoY start
    df = pd.read_csv(pre_dir +'oneY.csv',encoding='utf-8')
    df['count'] = range(len(df))
    df['val'] = df['val'].astype('float')
    title_str = '添加标记示例'
    x = df['count'].values.tolist()
    x_date = df['date'].values.tolist()
    y = df['val'].values.tolist()
    y_name = '值'
    xTick = []
    for i_x,i_xdate in zip(x,x_date):
        xTick.append((i_x,i_xdate))
    xTick00 = []
    for i in range(0,len(xTick),int(len(xTick)/20)):
        xTick00.append(xTick[i])
    res_data = {
        "x":x,
        "y":y,
        "xTick":xTick,
        "xTick00":xTick00,
        "title_str":title_str,
        "y_name":y_name
    }

    mark_index_list = []
    mark_str_list = []
    # 随机取折线图中的几个点
    for i in [5,10,200,1000,-300,-5]:
        mark_index_list.append([x[i],y[i]])
        temp_str = f"{xTick[i][1]} {y[i]}"
        mark_str_list.append(temp_str)

    QtCore.QCoreApplication.setAttribute(QtCore.Qt.HighDpiScaleFactorRoundingPolicy.PassThrough)
    app = QtWidgets.QApplication(sys.argv)
    temp_widget = PyQtGraphWidget()
    temp_widget.showMaximized()
    temp_widget.set_data(res_data)
    # 添加标记
    temp_widget.add_mark(mark_index_list,mark_str_list)
    # 去除标记
    # temp_widget.remove_mark()
    app.exec()
    # twoY end
    pass


 1833
1833


 被折叠的 条评论
为什么被折叠?
被折叠的 条评论
为什么被折叠?
 到【灌水乐园】发言


