


目录
效果:
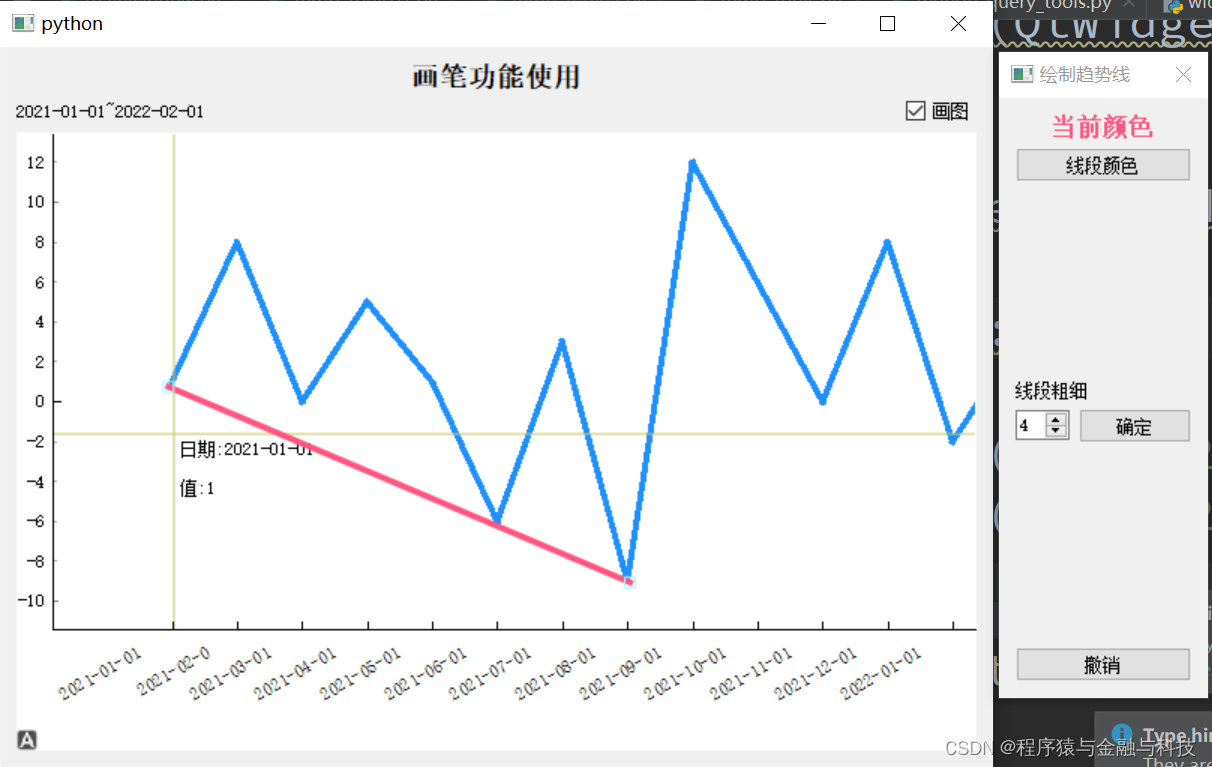
使用折线分析数据时,经常会需要使用线段在曲线上绘制趋势线,在此检查实现在折线图上绘制线段的功能。
代码:
需要使用的包导入
import sys
from PyQt5 import QtCore,QtGui,QtWidgets
from PyQt5.QtCore import Qt
from typing import Dict,Any,List
import pyqtgraph as pg
pg.setConfigOption('background','w')
pg.setConfigOption('foreground','k')
字符串横坐标,用以显示日期
class RotateAxisItem(pg.AxisItem):
    def drawPicture(self, p, axisSpec, tickSpecs, textSpecs):
        p.setRenderHint(p.Antialiasing,False)
        p.setRenderHint(p.TextAntialiasing,True)

        ## draw long line along axis
        pen,p1,p2 = axisSpec
        p.setPen(pen)
        p.drawLine(p1,p2)
        p.translate(0.5,0)  ## resolves some damn pixel ambiguity

        ## draw ticks
        for pen,p1,p2 in tickSpecs:
            p.setPen(pen)
            p.drawLine(p1,p2)

        ## draw all text
        # if self.tickFont is not None:
        #     p.setFont(self.tickFont)
        p.setPen(self.pen())
        for rect,flags,text in textSpecs:
            # this is the important part
            p.save()
            p.translate(rect.x(),rect.y())
            p.rotate(-30)
            p.drawText(-rect.width(),rect.height(),rect.width(),rect.height(),flags,text)
            # restoring the painter is *required*!!!
            p.restore()
画笔属性框:绘制线段用以设置线段颜色、线段粗细 、撤销上一条线段
class DrawLineSegmentWidget(QtWidgets.QWidget):
    sinout_signal = QtCore.pyqtSignal(object)
    def __init__(self):
        super().__init__()
        self.default_color: str = '#ff557f'
        self.init_ui()
        pass
    def init_ui(self):
        self.setWindowFlags(Qt.WindowStaysOnTopHint | Qt.WindowCloseButtonHint)
        self.setWindowTitle('绘制趋势线')
        self.setMinimumHeight(400)
        self.setMinimumWidth(100)

        self.current_color_label = QtWidgets.QLabel('当前颜色')
        self.current_color_label.setAlignment(Qt.AlignCenter)
        self.current_color_label.setStyleSheet('QLabel{font-size:16px;color:'+self.default_color+';font-weight:bold}')
        change_color_btn = QtWidgets.QPushButton('线段颜色')
        change_color_btn.clicked.connect(self.change_color_btn_clicked)
        layout_color = QtWidgets.QVBoxLayout()
        layout_color.addWidget(self.current_color_label)
        layout_color.addWidget(change_color_btn)
        layout_color.addStretch(1)

        tip_linewidth_label = QtWidgets.QLabel('线段粗细')
        self.linewidth_spin = QtWidgets.QSpinBox()
        self.linewidth_spin.setValue(4)
        linewidth_check_btn = QtWidgets.QPushButton('确定')
        linewidth_check_btn.clicked.connect(self.linewidth_check_btn_clicked)
        layout_linewidth = QtWidgets.QHBoxLayout()
        layout_linewidth.addWidget(self.linewidth_spin)
        layout_linewidth.addWidget(linewidth_check_btn)
        layout_linewidth_00 = QtWidgets.QVBoxLayout()
        layout_linewidth_00.addWidget(tip_linewidth_label)
        layout_linewidth_00.addLayout(layout_linewidth)
        layout_linewidth_00.addStretch(1)

        previous_step_btn = QtWidgets.QPushButton('撤销')
        previous_step_btn.clicked.connect(self.previous_step_btn_clicked)

        layout = QtWidgets.QVBoxLayout()
        layout.addLayout(layout_color)
        layout.addLayout(layout_linewidth_00)
        layout.addWidget(previous_step_btn)
        self.setLayout(layout)
        pass
    def change_color_btn_clicked(self):
        col = QtWidgets.QColorDialog.getColor()
        if col.isValid():
            pal = self.current_color_label.palette()
            pal.setColor(QtGui.QPalette.WindowText,col)
            self.current_color_label.setPalette(pal)
            pre_map = {
                'change_type':'color',
                'data':col.name()
            }
            self.sinout_signal.emit(pre_map)
        pass
    def previous_step_btn_clicked(self):
        pre_map = {
            'change_type': 'pre_step',
            'data': None
        }
        self.sinout_signal.emit(pre_map)
        pass
    def linewidth_check_btn_clicked(self):
        line_width = self.linewidth_spin.value()
        if int(line_width)<=0:
            QtWidgets.QMessageBox.information(
                self,
                '提示',
                '线条粗细必须大于0',
                QtWidgets.QMessageBox.Yes
            )
            return
        # linewidth
        pre_map = {
            'change_type':'linewidth',
            'data':int(line_width)
        }
        self.sinout_signal.emit(pre_map)
        pass
折线图控件
class PyQtGraphLineWidget(QtWidgets.QWidget):
    def __init__(self):
        super().__init__()
        self.init_data()
        self.init_ui()

    def init_data(self):
        self.draw_line_yeah: bool = False
        self.segment_list: List = []
        self.draw_widget: QtWidgets.QWidget = None
        self.draw_line_color: str = '#ff557f'
        self.draw_line_width: int = 4
        # 颜色值 https://www.sioe.cn/yingyong/yanse-rgb-16/
        self.color_one = (30, 144, 255)
        pass

    def init_ui(self):
        self.title_label = QtWidgets.QLabel('折线图')
        self.title_label.setAlignment(Qt.AlignCenter)
        self.title_label.setStyleSheet('QLabel{font-size:18px;font-weight:bold;}')

        self.tip_label = QtWidgets.QLabel('左边界~右边界')
        self.draw_lines_checkbox = QtWidgets.QCheckBox('画图')
        self.draw_lines_checkbox.clicked.connect(self.draw_lines_checkbox_clicked)
        layout_control = QtWidgets.QHBoxLayout()
        layout_control.addWidget(self.tip_label)
        layout_control.addStretch(1)
        layout_control.addWidget(self.draw_lines_checkbox)

        xax = RotateAxisItem(orientation='bottom')
        xax.setHeight(h=80)
        self.pw = pg.PlotWidget(axisItems={'bottom': xax})
        self.pw.setMouseEnabled(x=True, y=False)
        # self.pw.enableAutoRange(x=False,y=True)
        self.pw.setAutoVisible(x=False, y=True)
        layout = QtWidgets.QVBoxLayout()
        layout.addWidget(self.title_label)
        layout.addLayout(layout_control)
        layout.addWidget(self.pw)
        self.setLayout(layout)
        pass

    def set_data(self,data:Dict[str,Any]):
        self.set_data_1(data)
        self.proxy_clicked = pg.SignalProxy(self.pw.scene().sigMouseClicked, rateLimit=60, slot=self.mouseClicked)

    def set_data_1(self, data: Dict[str, Any]):
        '''单根y轴'''
        if data is None:
            self.pw.clear()
            return
        # 将上一次视图清空
        self.pw.clear()
        self.pw.addLegend()
        title_str = data['title_str']
        self.title_label.setText(title_str)
        xTick = [data['xTick00']]
        x = data['x']
        y = data['y']
        whole_data = data['whole_data']
        self.y_datas = y
        self.x_data = xTick
        self.x_Tick = data['xTick']
        self.whole_data = whole_data
        self.tip_label.setText(f"{xTick[0][0][1]}~{xTick[0][-1][1]}")

        xax = self.pw.getAxis('bottom')
        xax.setTicks(xTick)

        self.pw.plot(x, y, connect='finite', pen=pg.mkPen({'color': self.color_one, 'width': 4}))

        self.vLine = pg.InfiniteLine(angle=90, movable=False)
        self.hLine = pg.InfiniteLine(angle=0, movable=False)
        self.label = pg.TextItem()

        self.pw.addItem(self.vLine, ignoreBounds=True)
        self.pw.addItem(self.hLine, ignoreBounds=True)
        self.pw.addItem(self.label, ignoreBounds=True)
        self.vb = self.pw.getViewBox()
        self.proxy = pg.SignalProxy(self.pw.scene().sigMouseMoved, rateLimit=60, slot=self.mouseMoved)
        # 显示整条折线图
        self.pw.enableAutoRange()
        pass
    def mouseMoved(self, evt):
        pos = evt[0]
        if self.pw.sceneBoundingRect().contains(pos):
            mousePoint = self.vb.mapSceneToView(pos)
            index = int(mousePoint.x())
            if index>=0 and index<len(self.whole_data):
                cur_data = self.whole_data[index]
                html_str = ''
                for k,v in cur_data.items():
                    html_str += '<p style="color:black;">'+k+':'+str(v)+'</p>'
                self.label.setHtml(html_str)
                self.label.setPos(mousePoint.x(), mousePoint.y())
                pass
            self.vLine.setPos(mousePoint.x())
            self.hLine.setPos(mousePoint.y())
        pass
    def mouseClicked(self,evt):
        if not self.draw_line_yeah:
            pass
        else:
            pos = evt[0].pos()
            if self.pw.sceneBoundingRect().contains(pos):
                # 获取当前左下角
                pos_pre = pg.Point(pos[0]-10,pos[1]-10)
                mousePoint_pre = self.vb.mapSceneToView(pos_pre)
                pos_x_pre = mousePoint_pre.x()
                pos_y_pre = mousePoint_pre.y()
                mousePoint = self.vb.mapSceneToView(pos)
                pos_x = int(mousePoint.x())
                pos_y = int(mousePoint.y())

                # [(pos_x_00, pos_y_00), (pos_x, pos_y)]
                r = pg.LineSegmentROI([(pos_x_pre, pos_y_pre), (pos_x, pos_y)],
                                      pen={'color': self.draw_line_color, 'width': self.draw_line_width},
                                      movable=True,
                                      hoverPen={'color': (255, 255, 0), 'width': 8})
                self.segment_list.append(r)
                self.pw.addItem(r)
        pass
    def draw_lines_checkbox_clicked(self):
        if self.draw_lines_checkbox.isChecked():
            self.draw_line_yeah = True
            if self.draw_widget is None:
                self.draw_widget = DrawLineSegmentWidget()
                self.draw_widget.sinout_signal.connect(self.draw_widget_sinout_signal_emit)
            self.draw_widget.show()
            pass
        else:
            self.draw_line_yeah = False
            for item in self.segment_list:
                self.pw.removeItem(item)
            self.segment_list.clear()
            if self.draw_widget:
                self.draw_widget.close()
            pass
        pass
    def draw_widget_sinout_signal_emit(self,data:Dict[str,Any]):
        change_type = data['change_type']
        if change_type == 'color':
            self.draw_line_color = data['data']
        elif change_type == 'linewidth':
            self.draw_line_width = data['data']
        elif change_type == 'pre_step':
            if len(self.segment_list)>=1:
                last_item = self.segment_list[-1]
                self.pw.removeItem(last_item)
                self.segment_list.pop()
        pass
    pass
使用:
调用:
if __name__ == '__main__':
    temp_map = {}
    temp_map['xTick'] = [(0, '2021-01-01'),
                         (1, '2021-02-0'),
                         (2, '2021-03-01'),
                         (3, '2021-04-01'),
                         (4, '2021-05-01'),
                         (5, '2021-06-01'),
                         (6, '2021-07-01'),
                         (7, '2021-08-01'),
                         (8, '2021-09-01'),
                         (9, '2021-10-01'),
                         (10, '2021-11-01'),
                         (11, '2021-12-01'),
                         (12, '2022-01-01'),
                         (13, '2022-02-01'),
                         ]
    temp_map['xTick00'] = temp_map['xTick']
    temp_map['x'] = [0, 1, 2, 3, 4, 5, 6,7,8,9,10,11,12,13]
    temp_map['y'] = [1, 8, 0, 5, 1, -6, 3,-9, 12, 6, 0, 8, -2,3]
    temp_map['title_str'] = '画笔功能使用'
    temp_map['whole_data'] = [{'日期':'2021-01-01','值':1},
{'日期':'2021-02-01','值':8},
{'日期':'2021-03-01','值':0},
{'日期':'2021-04-01','值':5},
{'日期':'2021-05-01','值':1},
{'日期':'2021-06-01','值':-6},
{'日期':'2021-07-01','值':3},
{'日期':'2021-08-01','值':-9},
{'日期':'2021-09-01','值':12},
{'日期':'2021-10-01','值':6},
{'日期':'2021-11-01','值':0},
{'日期':'2021-12-01','值':8},
{'日期':'2022-01-01','值':-2},
{'日期':'2022-02-01','值':3}]

    QtCore.QCoreApplication.setAttribute(QtCore.Qt.HighDpiScaleFactorRoundingPolicy.PassThrough)
    app = QtWidgets.QApplication(sys.argv)
    temp_widget = PyQtGraphLineWidget()
    temp_widget.set_data(temp_map)
    temp_widget.show()
    sys.exit(app.exec_())
    pass
运行:
要绘制线段时,勾选右上角画图复选框
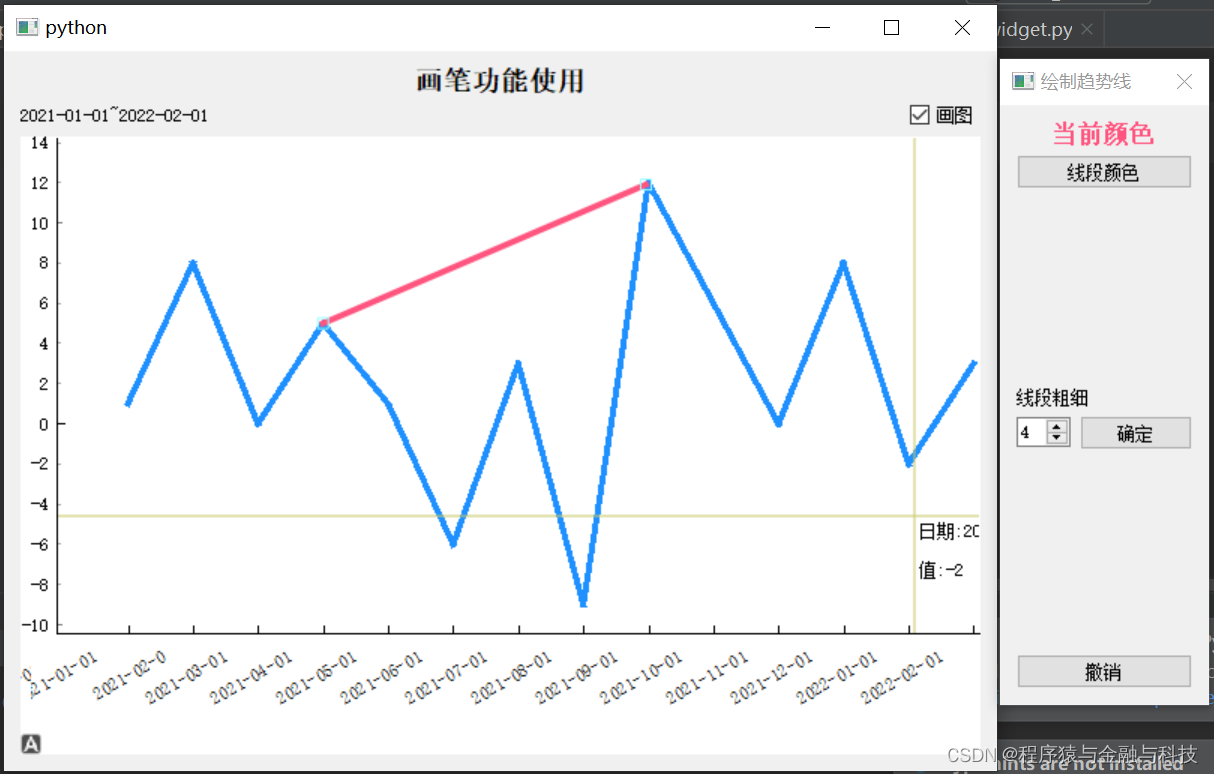 弹出的窗体可以理解为“画笔属性框”,在曲线中点击,会生成一条线段,该线段两个端点可以带动线段旋转,整条线段可以整体平移。
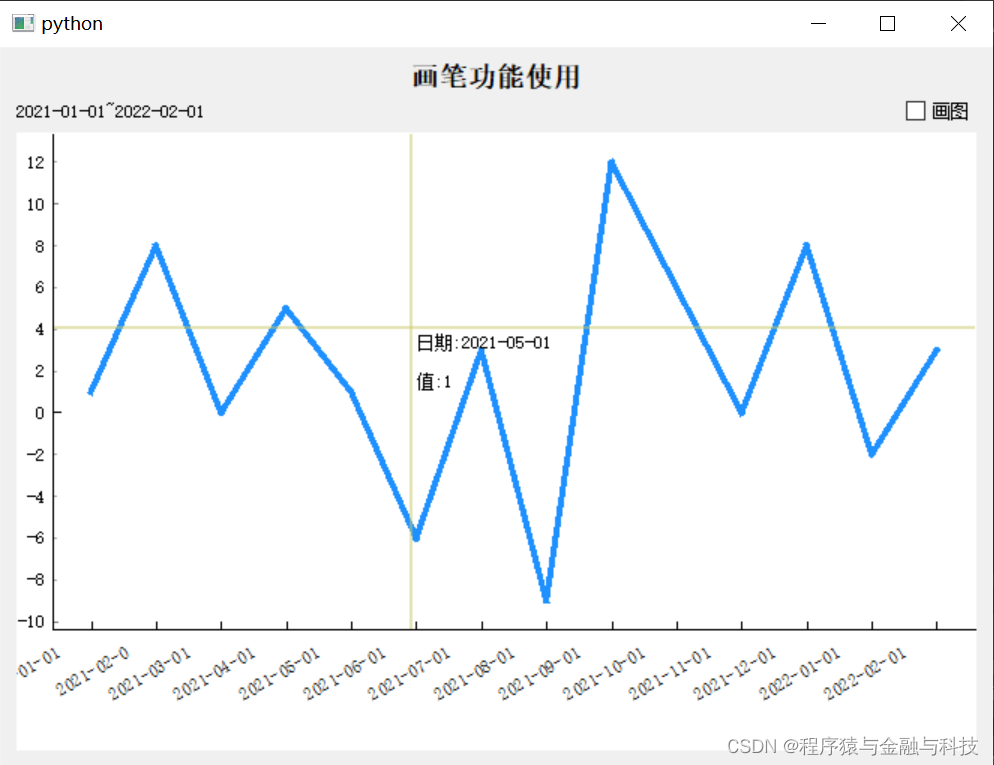
在此点击画图复选框,当复选框为未选中状态,画图功能关闭,并清除已绘制的线段


 1874
1874


 被折叠的 条评论
为什么被折叠?
被折叠的 条评论
为什么被折叠?
 到【灌水乐园】发言


