


使用简单的网络解决一个回归问题
import torch
import numpy as np
from torch.autograd import Variable
import matplotlib.pyplot as plt
五个要实现的函数,获取数据、获取权重、网络架构、损失函数、优化器。
def get_data():
    train_X = np.asarray([3.3,4.4,5.5,6.71,6.93,4.168,9.779,6.182,7.59,2.167,
                            7.042,10.791,5.313,7.997,5.654,9.27,3.1])
    train_Y = np.asarray([1.7,2.76,2.09,3.19,1.694,1.573,3.366,2.596,2.53,1.221,
                            2.827,3.465,1.65,2.904,2.42,2.94,1.3])
    dtype = torch.FloatTensor
    X = Variable(torch.from_numpy(train_X).type(dtype),requires_grad=False).view(17,1)
    y = Variable(torch.from_numpy(train_Y).type(dtype),requires_grad=False)
    return X, y


def get_weights():
    w = Variable(torch.randn(1).type(dtype=torch.FloatTensor), requires_grad=True)
    b = Variable(torch.randn(1).type(dtype=torch.FloatTensor), requires_grad=True)
    return w, b


def simple_network(x):
    y_pred = torch.matmul(x, w) + b
    return y_pred


def loss_fn(y, y_pred):
    loss = (y_pred - y).pow(2).sum()
    for param in [w, b]:
        if not param.grad is None: param.grad.data.zero_()
    loss.backward()
    return loss.data


def optimize(w, b, learning_rate):
    w.data -= learning_rate * w.grad.data
    b.data -= learning_rate * b.grad.data
    return w, b
训练代码
x, y = get_data()  # x - 表示训练数据,y - 表示目标变量
# x = x.cuda()
# y = y.cuda()

w, b = get_weights()  # w, b - 学习参数
# w = w.cuda()
# b = b.cuda()
# w.retain_grad()
# b.retain_grad()

for i in range(10000):
    y_pred = simple_network(x)  # 计算 wx + b 的函数
    loss = loss_fn(y, y_pred)  # 计算 y 和 y_pred 平方差的和
    if i % 50 == 0:
        print(loss)
    w, b = optimize(w, b, learning_rate=0.001)  # 调整 w, b,将损失最小化
tensor(18.7677)
tensor(4.4789)
tensor(3.8478)
tensor(3.4304)
tensor(3.1544)
tensor(2.9719)
tensor(2.8512)
tensor(2.7714)
tensor(2.7186)
tensor(2.6837)
tensor(2.6606)
tensor(2.6454)
tensor(2.6353)
tensor(2.6286)
tensor(2.6242)
tensor(2.6213)
tensor(2.6193)
tensor(2.6181)
tensor(2.6172)
tensor(2.6167)
tensor(2.6163)
tensor(2.6161)
tensor(2.6159)
tensor(2.6158)
tensor(2.6157)
...
tensor(2.6156)
tensor(2.6156)
tensor(2.6156)
tensor(2.6156)
w, b
(tensor([0.2516], device='cuda:0', grad_fn=<ToCopyBackward0>),
 tensor([0.7988], device='cuda:0', grad_fn=<ToCopyBackward0>))
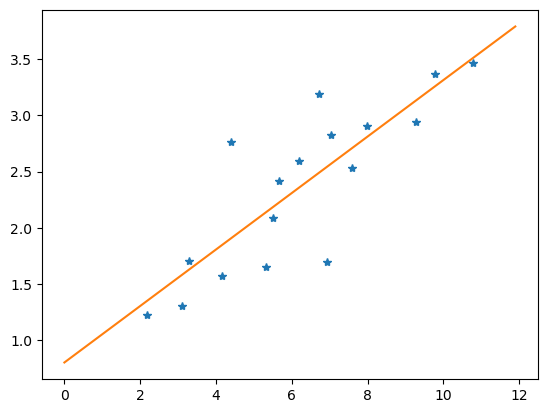
展示数据
plt.figure(1)
plt.plot(x, y, '*')  # 画原始数据点

x1 = np.arange(0, 12, 0.1)
y1 = w.detach().numpy() * x1 + b.detach().numpy()
plt.plot(x1, y1)
[<matplotlib.lines.Line2D at 0x1a848543fa0>]


 934
934


 被折叠的 条评论
为什么被折叠?
被折叠的 条评论
为什么被折叠?
 到【灌水乐园】发言


