


前言
对于特征图可视化感兴趣可以参考我的另一篇记录:六行代码实现:特征图提取与特征图可视化,可以实现分类网络的特征图可视化
最近忙论文,想在yolov5上面做一些改进,看源码看了一段时间,动手改改代码做一些改进,所以做个一系列改进的记录。
一、特征图可视化
yolov5最近的版本提供了特征图可视化的功能,在使用detect.py进行推理时,在命令行参数传入--visualize即可。
python detect.py --weights best.pt --conf 0.5 --source ../dog.png --visualize
传入visualize参数后会可视化所有层的特征图,文件默认保存在runs/detect/exp 文件夹下
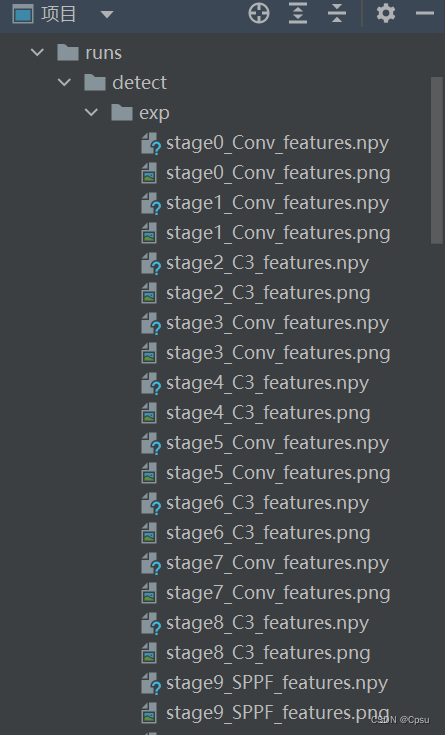
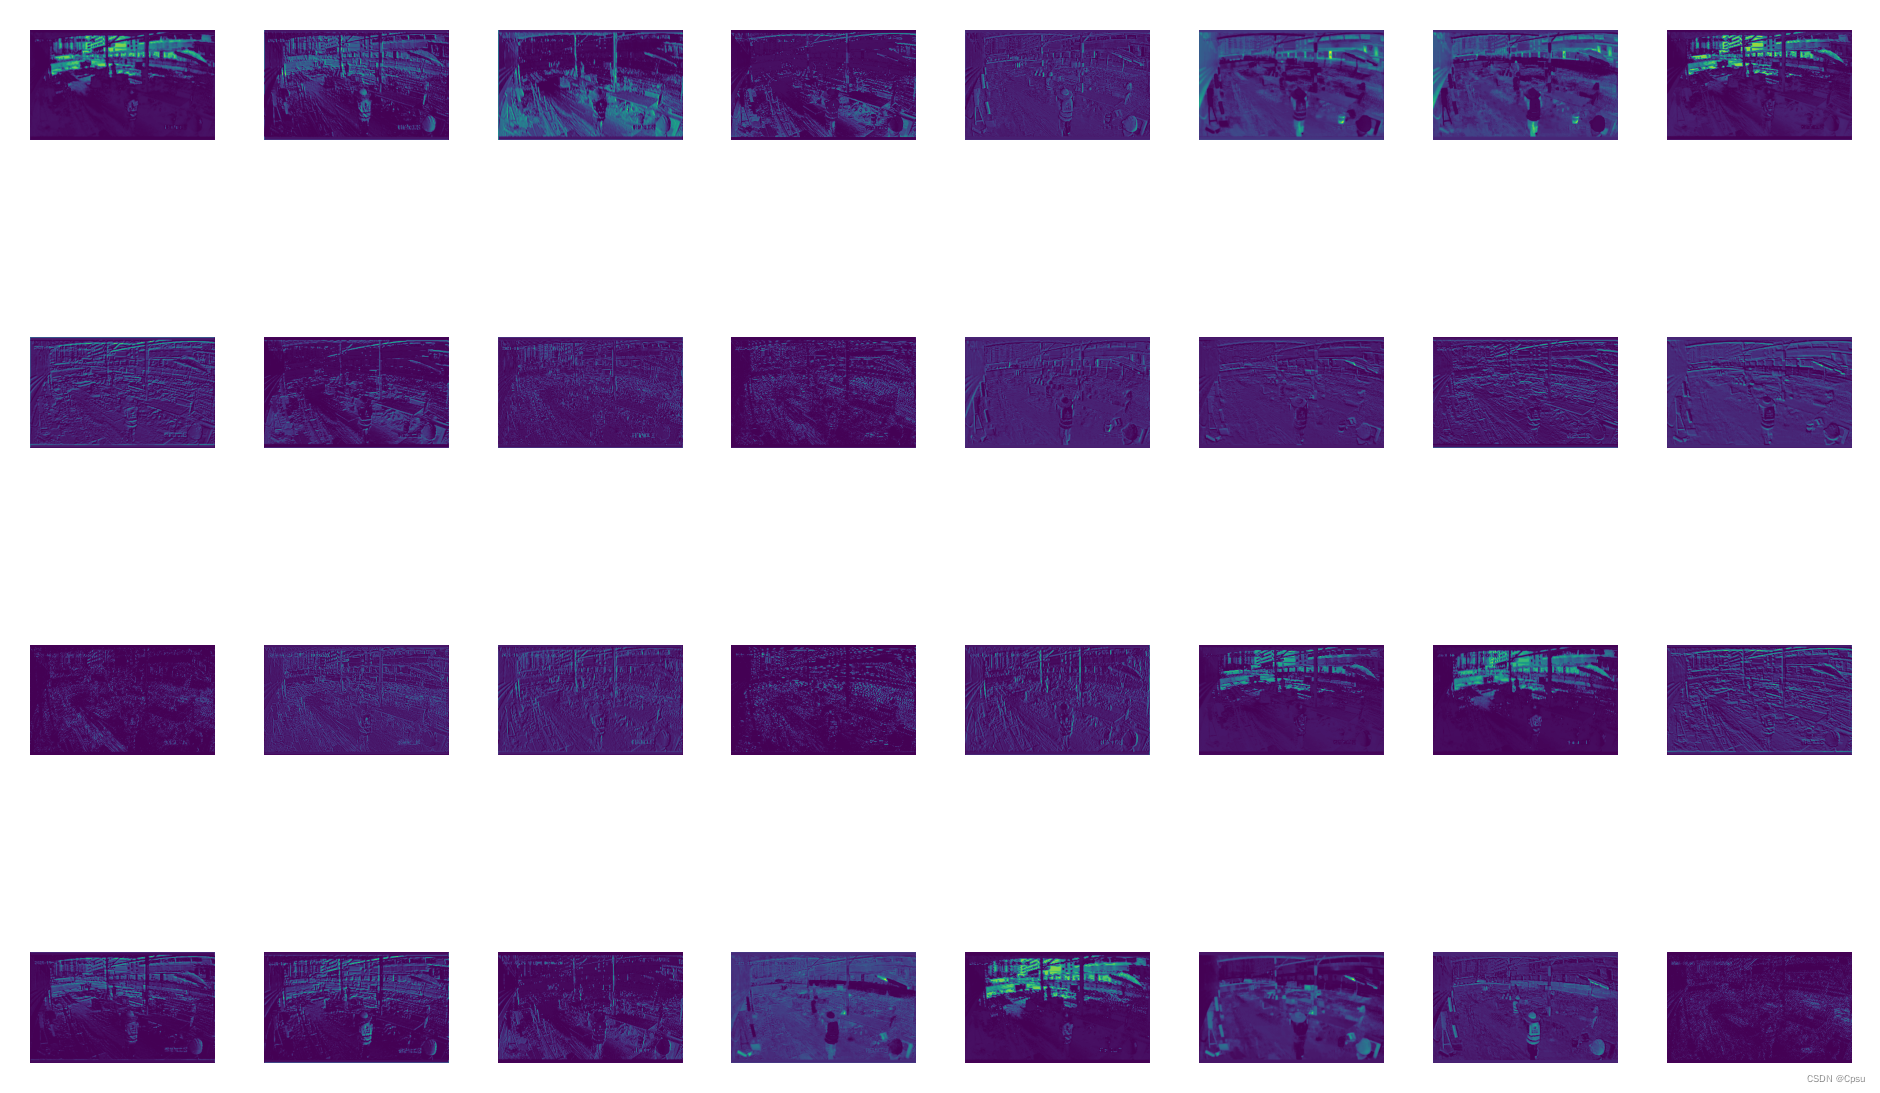
yolov5 这里是针对单个通道进行可视化(默认最多可视化32个通道),参考GitHub的相关issue,可以自行修改feature_visualization的各个参数
# utils/plots.py

def feature_visualization(x, module_type, stage, n=32, save_dir=Path('runs/detect/exp')):
    """
    x:              输入即可视化的Tensor
    module_type:    Module type 用于命名区分各层特征图
    stage:          Module stage within model 用于命名区分各层特征图
    n:              Maximum number of feature maps to plot 可视化的通道个数(通道数太多不可能全部可视化)
    save_dir:       Directory to save results 特征图的保存路径
    """
    if 'Detect' not in module_type:
        batch, channels, height, width = x.shape  # batch, channels, height, width
        if height > 1 and width > 1:
        	# 文件的命名格式 层名+层的索引
            f = save_dir / f"stage{stage}_{module_type.split('.')[-1]}_features.png"  # filename
			# 按通道数拆分Tensor
			# 进行逐通道的可视化
            blocks = torch.chunk(x[0].cpu(), channels, dim=0)  # select batch index 0, block by channels
            n = min(n, channels)  # number of plots
            fig, ax = plt.subplots(math.ceil(n / 8), 8, tight_layout=True)  # 8 rows x n/8 cols
            ax = ax.ravel()
            plt.subplots_adjust(wspace=0.05, hspace=0.05)
            for i in range(n):
                ax[i].imshow(blocks[i].squeeze())  # cmap='gray'
                ax[i].axis('off')

            LOGGER.info(f'Saving {f}... ({n}/{channels})')
            plt.savefig(f, dpi=300, bbox_inches='tight')
            plt.close()
            np.save(str(f.with_suffix('.npy')), x[0].cpu().numpy())  # npy save
二、可视化指定层
如果不想可视化所有的特征层,比如只需要可视化第一个卷积层的输出那么只需要修改判断条件即可,
将 if visualize: 修改为 if m.type == 'models.common.Conv' and m.i == 0:
# models/yolo.py文件


class BaseModel(nn.Module):
    # YOLOv5 base model
    def forward(self, x, profile=False, visualize=False):
        return self._forward_once(x, profile, visualize)  # single-scale inference, train

    def _forward_once(self, x, profile=False, visualize=False):
        y, dt = [], []  # outputs
        for m in self.model:
            if m.f != -1:  # if not from previous layer
                x = y[m.f] if isinstance(m.f, int) else [x if j == -1 else y[j] for j in m.f]  # from earlier layers
            if profile:
                self._profile_one_layer(m, x, dt)
            x = m(x)  # run
            y.append(x if m.i in self.save else None)  # save output
            """
            可视化指定层只需要更改一下判断条件即可
            将 if visualize:
            修改为 if m.type == 'models.common.Conv' and m.i == 0:
            """
            # 修改前
            # if visualize:

            # 修改后
            if m.type == 'models.common.Conv' and m.i == 0:
                feature_visualization(x, m.type, m.i)
        return x
......
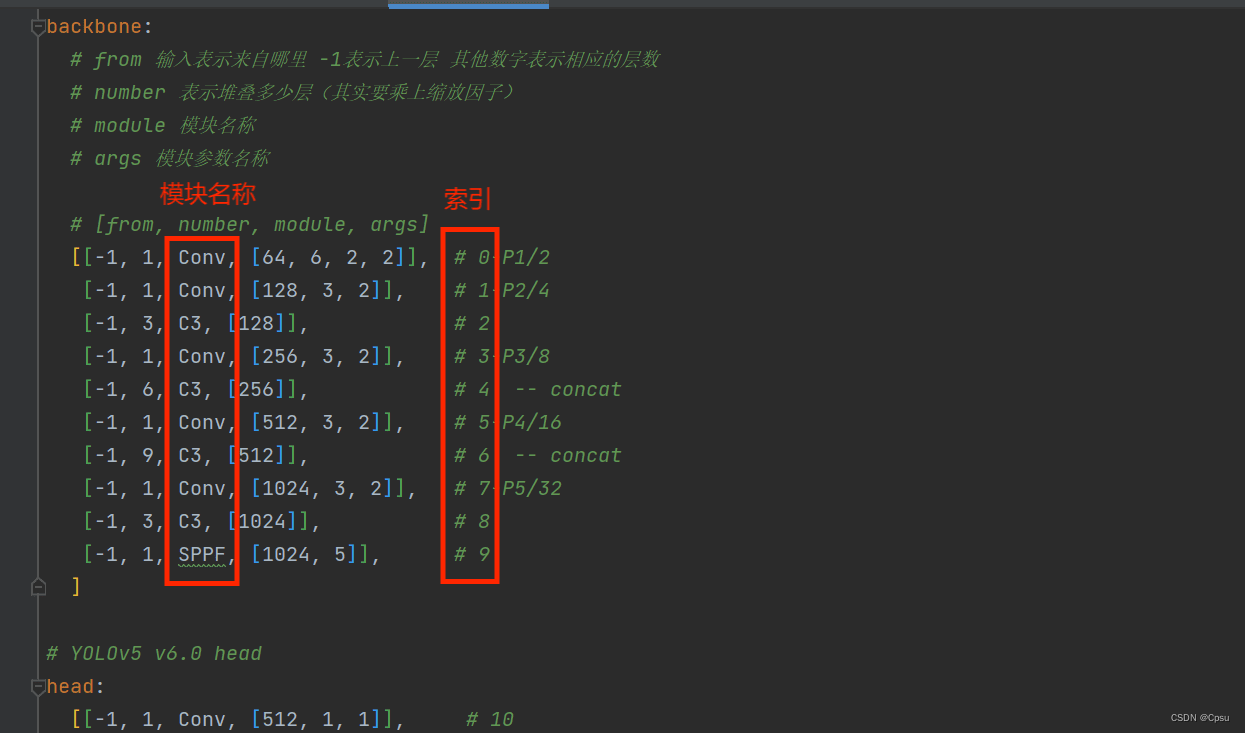
m.type 表示模块名称,m.i表示层的索引(即第几层),因为有重名的层需要索引加以区分
m.type的命名以 models.common. + 模块名,比如可视化SPPF就是 models.common.SPPF
m.i 即每个层对应得索引,SPPF对应得索引是9
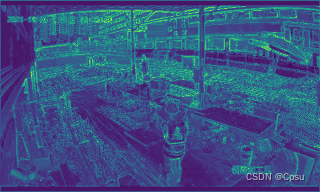
三、合并通道可视化
如果不想分通道可视化,可以直接可视化整个Tensor。把下面得函数定义加入到utils/plots.py文件下
def feature_visualization_all(x, module_type, stage,  save_dir=Path('runs/detect/exp')):
    """
    x:              Features to be visualized
    module_type:    Module type
    stage:          Module stage within model
    n:              Maximum number of feature maps to plot
    save_dir:       Directory to save results
    """
    if 'Detect' not in module_type:
        batch, channels, height, width = x.shape  # batch, channels, height, width
        if height > 1 and width > 1:
            f = save_dir / f"stage{stage}_{module_type.split('.')[-1]}_features.png"  # filename
            img = x[0].cpu().transpose(0, 1).sum(1).detach().numpy()
            plt.imsave(f, img)
            LOGGER.info(f'Saving {f}...')
随后在models/yolo.py文件下导入并调用
from models.common import *  # noqa
from models.experimental import *  # noqa
from utils.autoanchor import check_anchor_order
from utils.general import LOGGER, check_version, check_yaml, make_divisible, print_args

# 导入feature_visualization_all
from utils.plots import feature_visualization, feature_visualization_all
from utils.torch_utils import (fuse_conv_and_bn, initialize_weights, model_info, profile, scale_img, select_device, time_sync)


......

class BaseModel(nn.Module):
    # YOLOv5 base model
    def forward(self, x, profile=False, visualize=False):
        return self._forward_once(x, profile, visualize)  # single-scale inference, train

    def _forward_once(self, x, profile=False, visualize=False):
        y, dt = [], []  # outputs
        for m in self.model:
            if m.f != -1:  # if not from previous layer
                x = y[m.f] if isinstance(m.f, int) else [x if j == -1 else y[j] for j in m.f]  # from earlier layers
            if profile:
                self._profile_one_layer(m, x, dt)
            x = m(x)  # run
            y.append(x if m.i in self.save else None)  # save output

            # 修改后
            if m.type == 'models.common.Conv' and m.i == 0:
                feature_visualization_all(x, m.type, m.i)
        return x

......
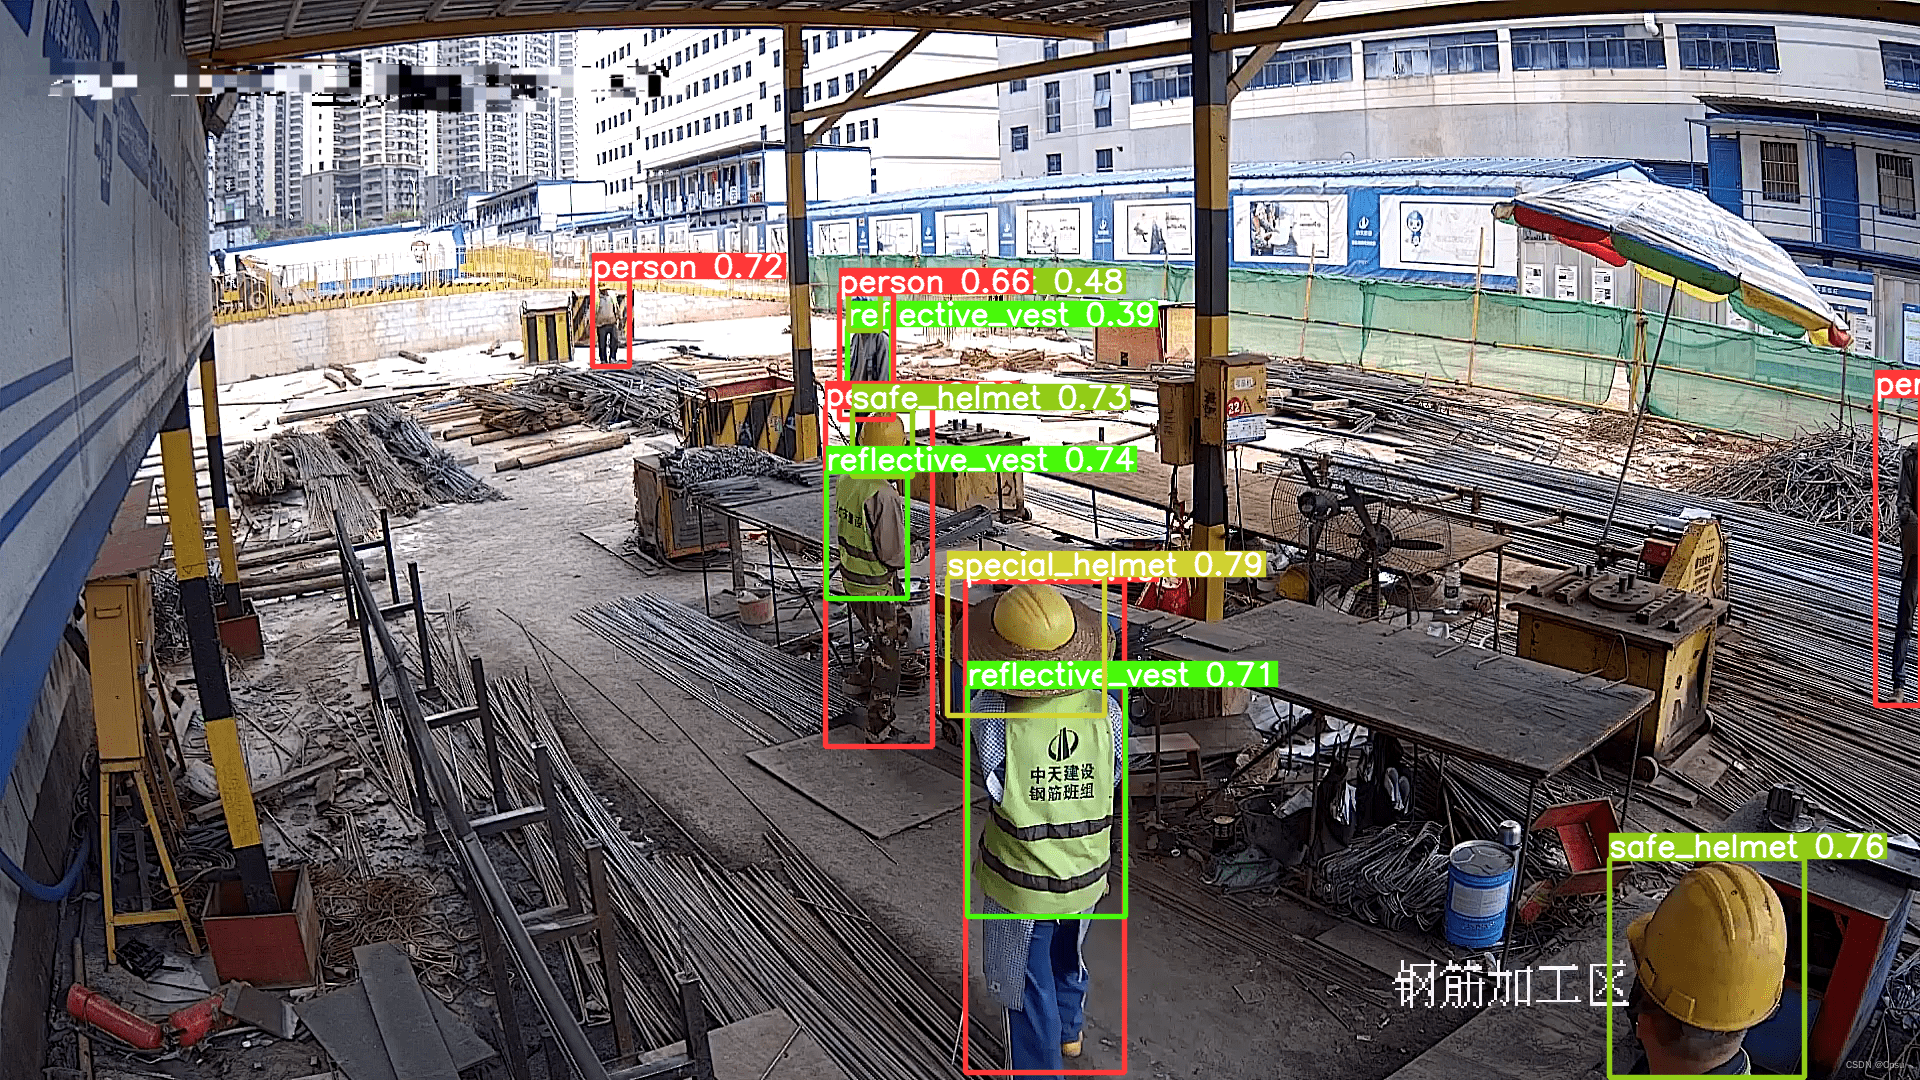
原图及检测效果:
合并通道特征图可视化:
总结
对于特征图可视化感兴趣可以参考我的另一篇记录:六行代码实现:特征图提取与特征图可视化,可以实现分类网络得特征图可视化


 3718
3718


 被折叠的 条评论
为什么被折叠?
被折叠的 条评论
为什么被折叠?
 到【灌水乐园】发言


