


Gallery - PyMOLWiki https://pymolwiki.org/index.php/Gallery美观的PyMOL生成的图像及其脚本。(需要科学上网)
这个官方社区网站聚集了大量大佬以及他们的pymol脚本。使用pymol的脚本作图会更方便!
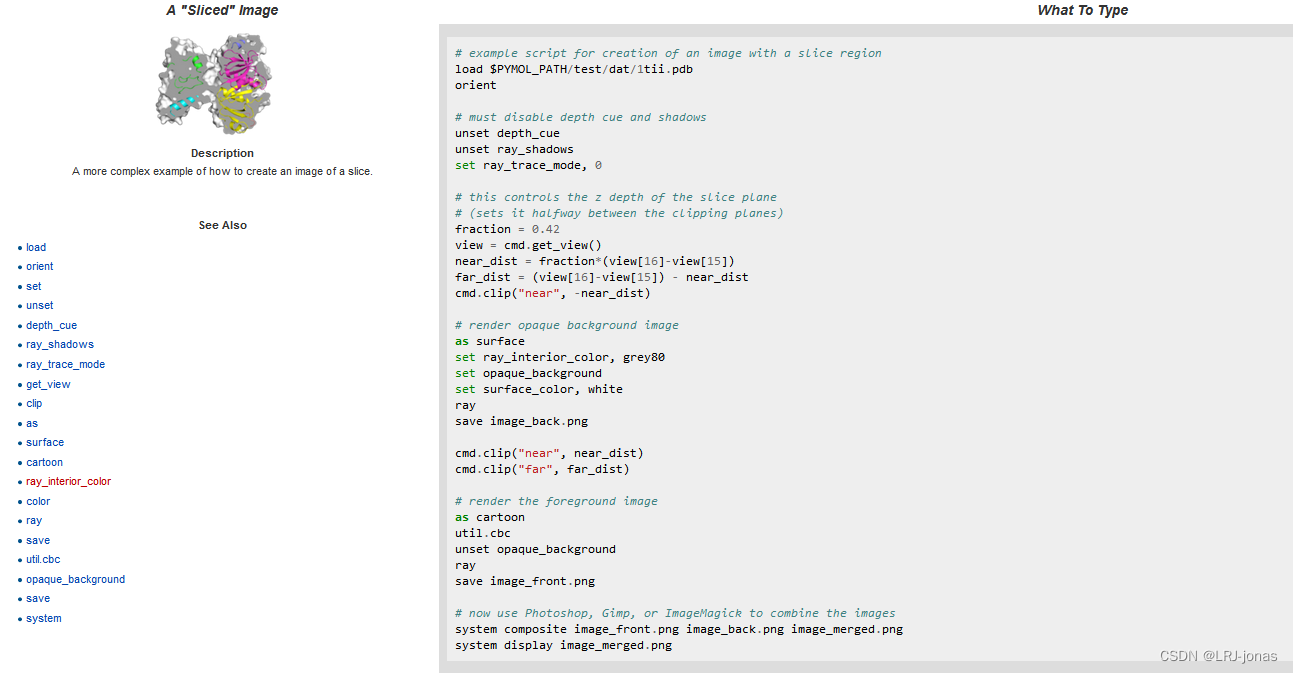
# example script for creation of an image with a slice region
load $PYMOL_PATH/test/dat/1tii.pdb
orient

# must disable depth cue and shadows
unset depth_cue
unset ray_shadows
set ray_trace_mode, 0

# this controls the z depth of the slice plane
# (sets it halfway between the clipping planes)
fraction = 0.42
view = cmd.get_view()
near_dist = fraction*(view[16]-view[15])
far_dist = (view[16]-view[15]) - near_dist
cmd.clip("near", -near_dist)

# render opaque background image
as surface
set ray_interior_color, grey80
set opaque_background
set surface_color, white
ray
save image_back.png

cmd.clip("near", near_dist)
cmd.clip("far", far_dist)

# render the foreground image
as cartoon
util.cbc
unset opaque_background
ray
save image_front.png

# now use Photoshop, Gimp, or ImageMagick to combine the images
system composite image_front.png image_back.png image_merged.png
system display image_merged.png
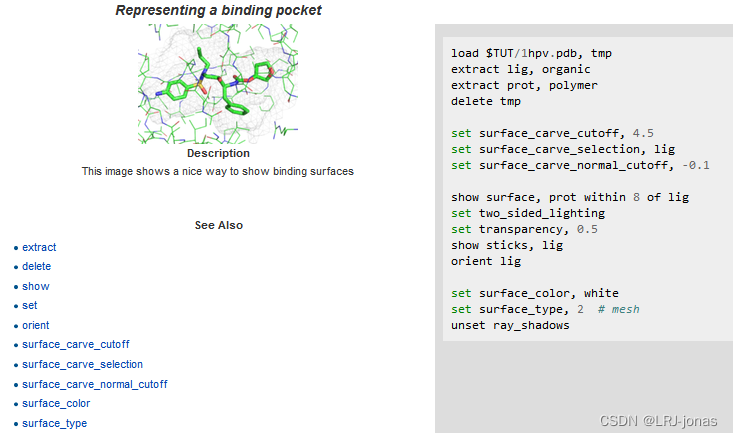
pymol展现对接口袋:
load $TUT/1hpv.pdb, tmp
extract lig, organic
extract prot, polymer
delete tmp

set surface_carve_cutoff, 4.5
set surface_carve_selection, lig
set surface_carve_normal_cutoff, -0.1

show surface, prot within 8 of lig
set two_sided_lighting
set transparency, 0.5
show sticks, lig
orient lig

set surface_color, white
set surface_type, 2  # mesh
unset ray_shadows
赶紧去玩玩。
pymol 选择对接的分子5A 范围内的氨基酸残基
图形界面选中配体,action - modify - around 5A residues
9pc是4dxd这个蛋白质晶体中的配体,以9pc为中心,在4dxd这个蛋白质里找出跟9pc距离在5 A的氨基酸,生成一个pocket,:
>>> create pocket, byres 4dxd within 5 of resn 9pc
或者下面的命令
>>> select 5Alig, byres lig around 5
>>> show sticks, 5Alig
选择残基100.102,108-111
select res, resi 100+102+108-111
阴影关掉
set ray_shadow, off
ray 渲染,然后保存图片(分辨率为300dpi) 及pse格式
出版社要求全版图片宽度≤2000像素,半版图片宽度≤1000像素,分辨率≥300 dpi
save pocket.pse
png h_bond.png, width=20cm, height=20cm, dpi=600
参考链接:
https://blog.csdn.net/xiaolan39/article/details/111066591


 被折叠的 条评论
为什么被折叠?
被折叠的 条评论
为什么被折叠?
 到【灌水乐园】发言


