


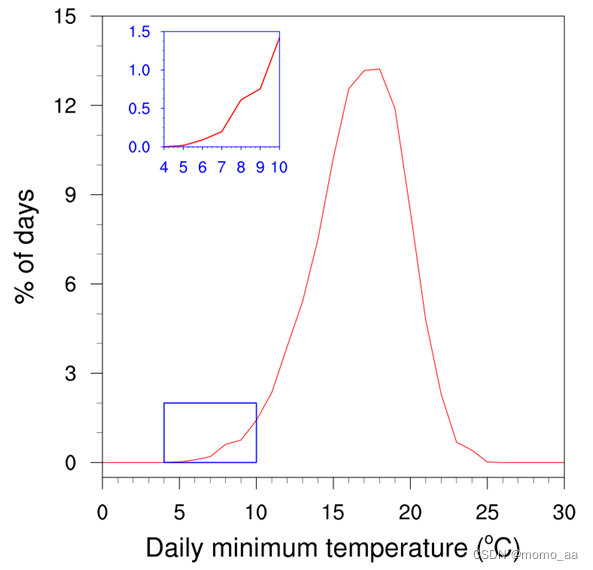
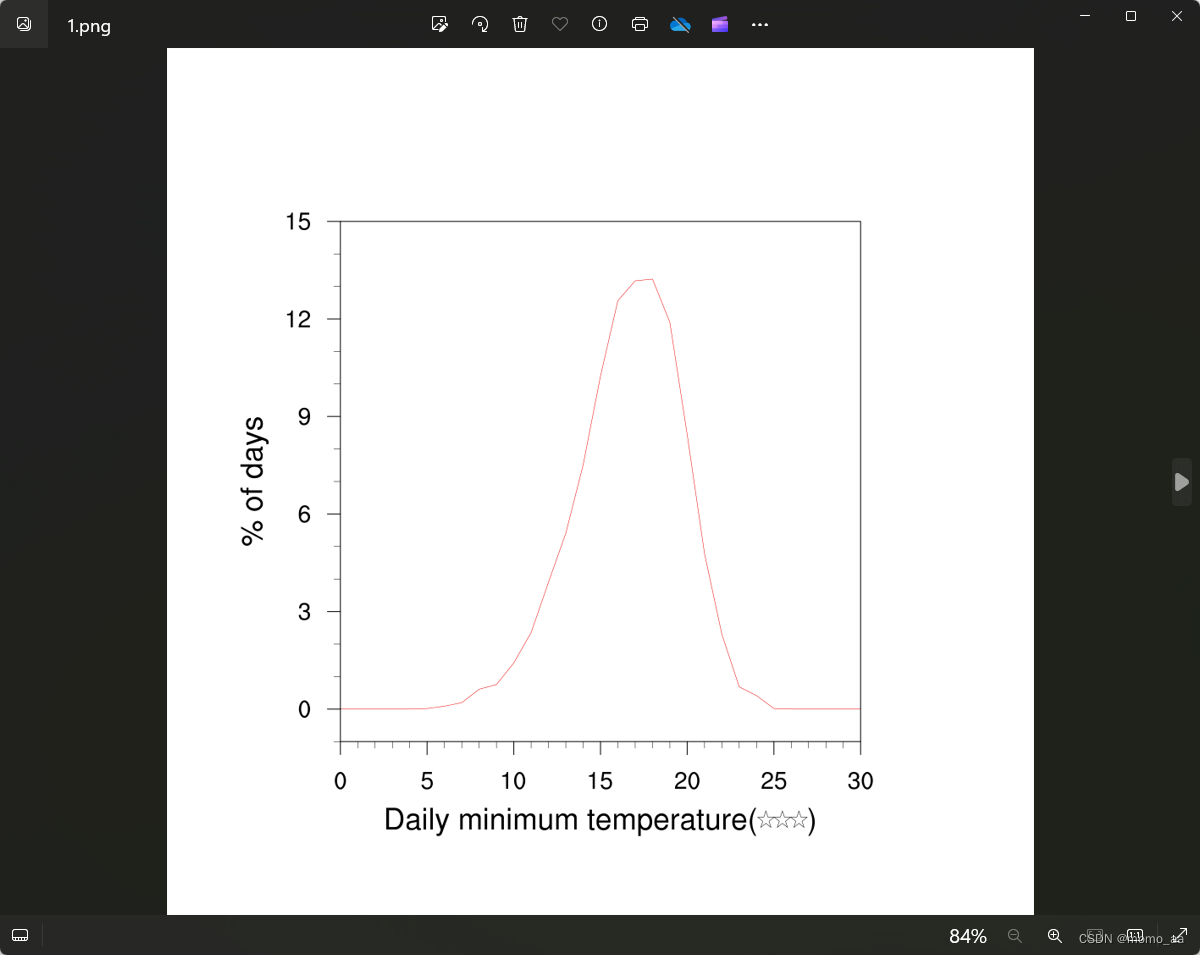
目标图形
难点汇总
1. ℃怎样在NCL中表示
(~S~o~N~C)
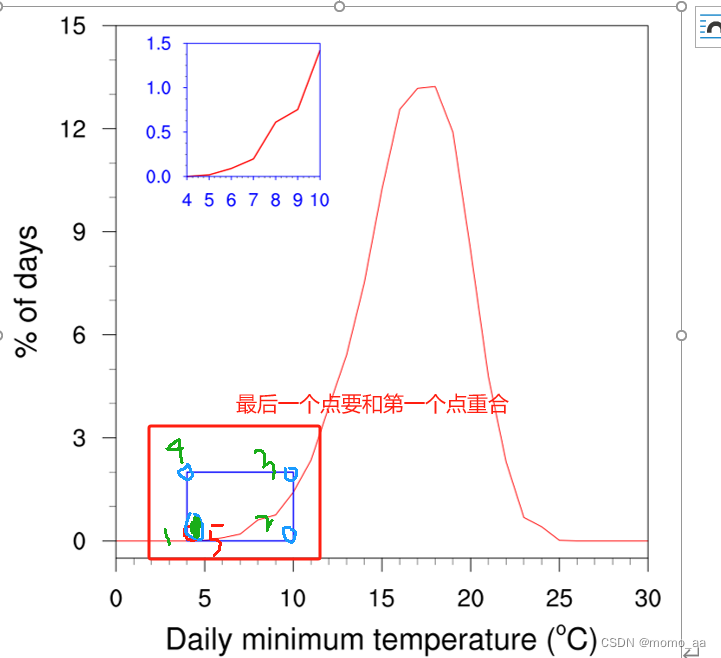
2. 怎样添加矩形?
老师提示用gsn_add_ployline(wks,plot,x,y,res)这个函数
	; 在 plot 上添加矩形

	resl 		= True

	; 设定线条的粗细度及颜色
	res1@gsLineColor = "blue"
    res1@gsLineDashPattern = 6
    res1@gsLineThicknessF = 3.0
	plot2 = gsn_add_polyline(wks,plot,(4,10),(0,2),res1)
我以为x,y是这样直接表示,后来看同学代码才知道是这个矩形的四个点(5个点)顺序可以乱,只要最后和开始的点重合就可以
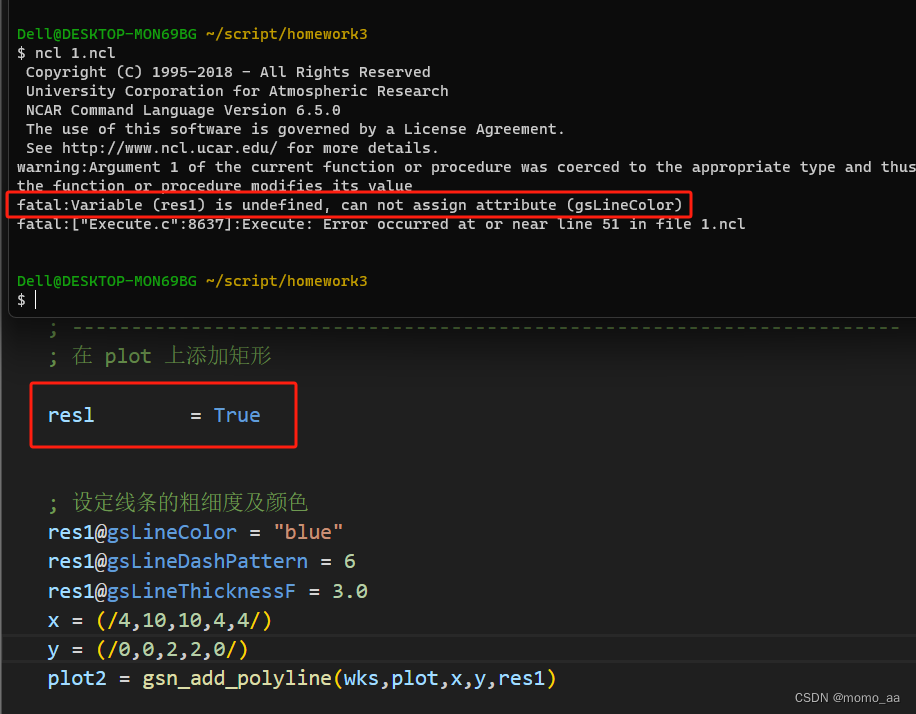
3. (已解决)又报错了,res1不是定义了吗?为什么还会报错???
因为老师的代码里是resl。。。。俺服咯
4. 又报错,不知道为什么说我不匹配。我知道了,因为我上面用过小写x,y这个变量
首先画大图
最终Code
begin
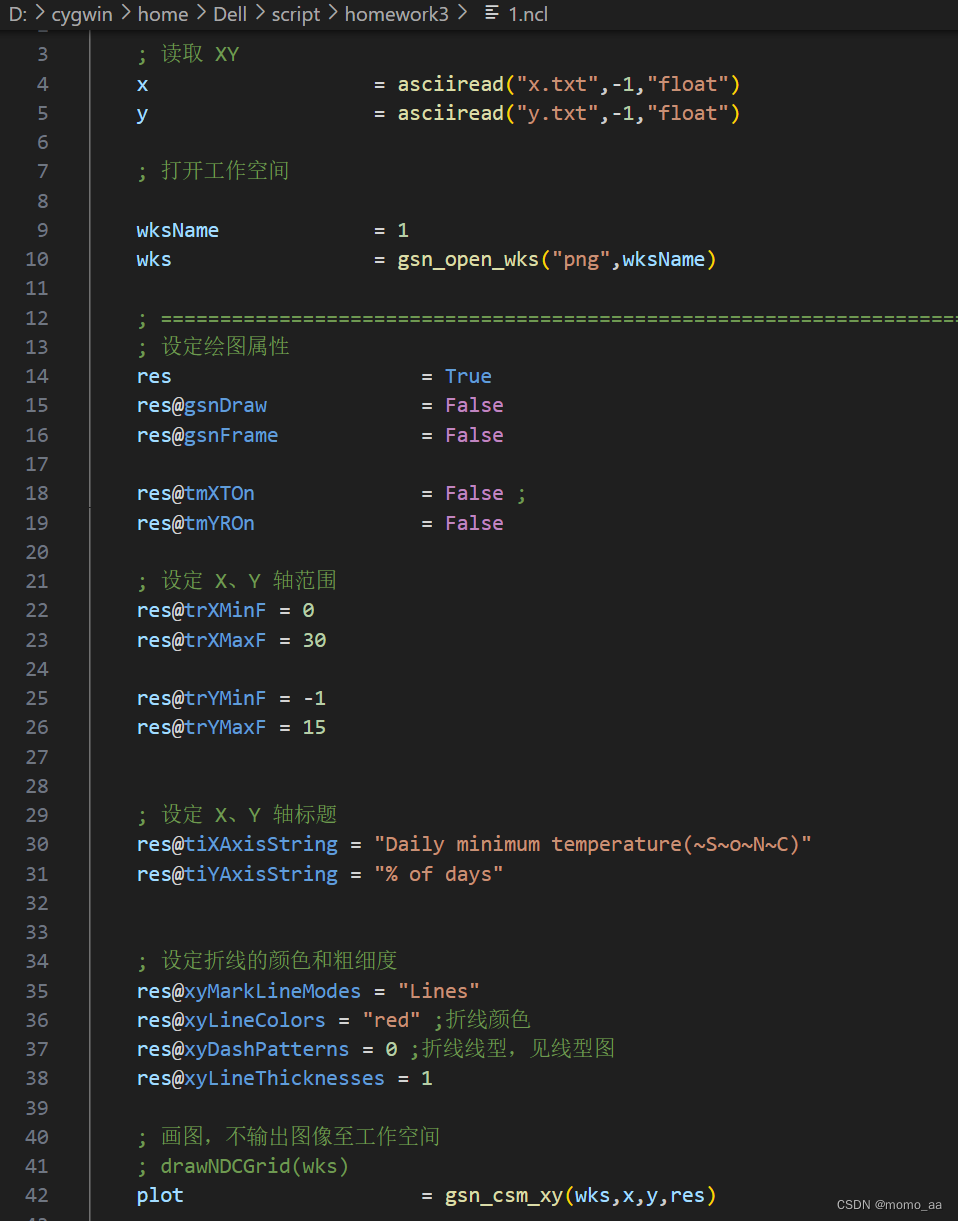
; 读取 XY
x = asciiread("x.txt",-1,"float")
y = asciiread("y.txt",-1,"float")
; 打开工作空间
wksName = 1
wks = gsn_open_wks("png",wksName)
; ======================================================================
; 设定绘图属性
res = True
res@gsnDraw = False
res@gsnFrame = False
res@tmXTOn = False ;
res@tmYROn = False
; 设定 X、Y 轴范围
res@trXMinF = 0
res@trXMaxF = 30
res@trYMinF = -1
res@trYMaxF = 15
; 设定 X、Y 轴标题
res@tiXAxisString = "Daily minimum temperature(~S~o~N~C)"
res@tiYAxisString = "% of days"
; 设定折线的颜色和粗细度
res@xyMarkLineModes = "Lines"
res@xyLineColors = "red" ;折线颜色
res@xyDashPatterns = 0 ;折线线型
res@xyLineThicknesses = 1
; 画图,不输出图像至工作空间
;drawNDCGrid(wks)
plot = gsn_csm_xy(wks,x,y,res)
; ----------------------------------------------------------------------
; 在 plot 上添加矩形
res1 = True
; 设定线条的粗细度及颜色
res1@gsLineColor = "blue"
;res1@gsLineDashPattern = 1
res1@gsLineThicknessF = 3.0
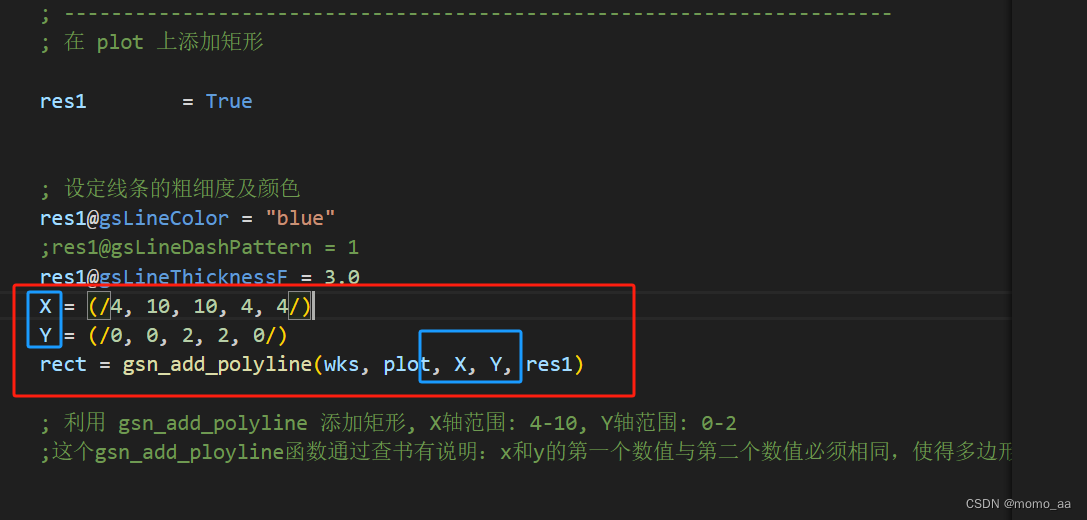
X = (/4, 10, 10, 4, 4/)
Y = (/0, 0, 2, 2, 0/)
rect = gsn_add_polyline(wks, plot, X, Y, res1)
; 利用 gsn_add_polyline 添加矩形, X轴范围: 4-10, Y轴范围: 0-2
;这个gsn_add_ployline函数通过查书有说明:x和y的第一个数值与第二个数值必须相同,使得多边形重合
; ----------------------------------------------------------------------
; 设定小图的绘图属性
res2 = True
res2@gsnDraw = True
res2@gsnFrame = False
; 利用 vpHeightF 和 vpWidthF 设定小图的宽度及高度
res2@vpHeightF = 0.15
res2@vpWidthF = 0.15
; 利用 vpXF 及 vpYF 设定小图在大图的左上方
res2@vpXF = 0.25
res2@vpYF = 0.75
; 设定 X 轴及 Y 轴的范围值及tickmark的间隔 等
res2@trXMinF = 4
res2@trXMaxF = 10
res2@trYMinF = 0.0
res2@trYMaxF = 1.5
res2@tmXTOn = False
;res2@tmXBValues = (/4, 5, 6, 7, 8, 9, 10/)
res2@tmXBLabelFontColor = "blue"
res2@tmXBMajorLineColor = "blue"
res2@tmXBMinorLineColor = "blue"
res2@tmYROn = False
res2@tmYLMode = "Explicit"
res2@tmYLValues = (/0, 0.5, 1.0, 1.5/)
res2@tmYLLabels = (/"0.0", "0.5", "1.0", "1.5"/)
res2@tmYLMinorValues = (/0.15, 0.3, 0.65, 0.8, 1.15, 1.3/)
res2@tmYLLabelFontColor = "blue"
; 设定 XY 线线条的颜色
res2@xyLineColor = "red"
; 设定 X,Y 轴标记的字体大小
res2@tmXBLabelFontHeightF = 0.015
res2@tmYLLabelFontHeightF = 0.015
; 画小图,无需抽取数据,采用大图的数据便可
plot2 = gsn_csm_xy(wks, x, y, res2)
; 输出工作空间
draw(plot)
draw(plot2)
frame(wks)
end


 8192
8192

 被折叠的 条评论
为什么被折叠?
被折叠的 条评论
为什么被折叠?
 到【灌水乐园】发言


