


 本文介绍了如何使用NCL(NCAR Command Language)来创建折线图,包括标题、坐标轴的设置以及多根折线和图例的处理。通过示例脚本和执行过程,展示了NCL在图形绘制上的应用。
一、NCL标题及坐标轴设置
1、首先定义好文件目录,比如程序存放目录和文件输出目录
2、开始编写程序:写法和我之前用的语言大同小异
begin
npts = 500
y = 500.+.9* ispan(0,npts-1,1)*sin(0.031415926535898*ispan(0,npts-1,1))
y1=ispan(0,npts-1,1) ;这个画出来的图就是y=x
wks = gsn_open_wks("png","/cygdrive/d/learn/ncl-test/output/ex_title")
res = True
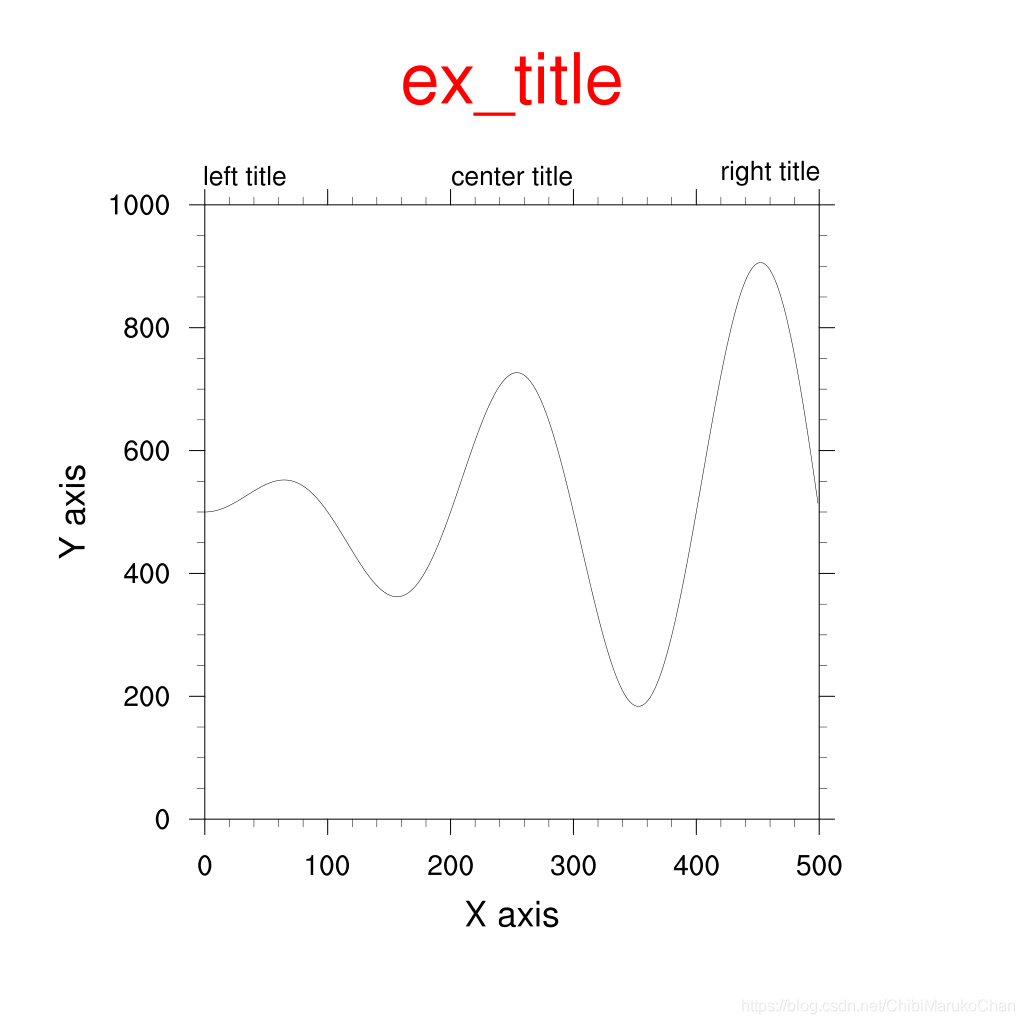
res@tiMainString="ex_titl" ;添加图片主题
res@tiMainFontHeightF=0.05 ;主题字体大小
res@tiMainFontColor="red" ;主题字体颜色
res@gsnCenterString="center title"
res@gsnLeftString="left title"
res@gsnRightString="right title"
res@tiXAxisString="X axis"
res@tiYAxisString="Y axis"
res@tiXAxisFontColor="black"
plot = gsn_csm_y(wks,y,res)
end
3、执行脚本:
ncl /cygdrive/d/learn/ncl-test/script-upload/ex_title.ncl
4、在d/learn/ncl-test/output文件下会出现title1_ex.png,如图:
二、多根折线及图例
begin
npts = 500
x = fspan(-100,100,npts) ;创建一个从-100到100的500个数值的等差数列
y = new((/4,500/),"float")
y(0,:) =sin(0.0628*x)
y(1,:) =cos(0.0628*x)
y(2,:) =cos(0.0628*x)*sin(0.0628*x)
y(3,:) =cos(0.0628*x)+sin(0.0628*x)
wks=gsn_open_wks("png", "/cygdrive/d/learn/ncl-test/output/xyLengend")
res = True
res@trXMinF = min(x)
res@trXMaxF = max(x)
res@trYMinF = min(y) - 0.2
res@trYMaxF = max(y) + 0.6
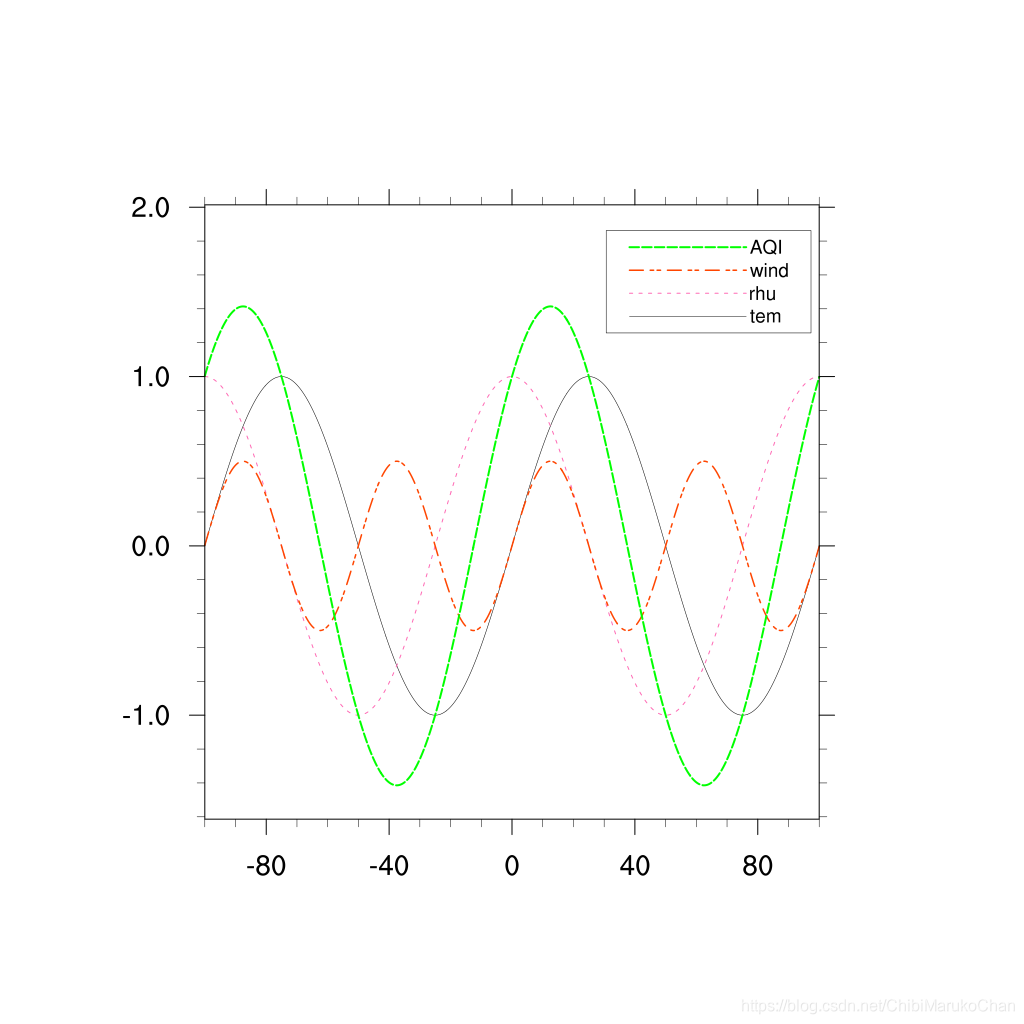
res@xyLineThicknesses = (/1,2,3,4/)
res@xyLineColors = (/"black","HotPink","OrangeRed","Green"/) ;line color
res@xyDashPatterns =(/0,2,4,6/) ;differ lines
res@pmLegendDisplayMode = "Always" ;add lengend
res@xyExplicitLegendLabels = (/"tem","rhu","wind","AQI"/) ;lengend title by english
res@pmLegendWidthF = 0.2 ;lengend width
res@pmLegendHeightF = 0.1 ;lengend height
res@pmLegendOrthogonalPosF = -1.05 ;
res@pmLegendParallelPosF = 0.82
plot = gsn_csm_xy(wks,x,y,res)
end
执行:
ncl /cygdrive/d/learn/ncl-test/script-upload/ex_xy_lengend.ncl
输出:


 1220
1220

 被折叠的 条评论
为什么被折叠?
被折叠的 条评论
为什么被折叠?
 到【灌水乐园】发言


